Vizlib Filter: Using a Filter component in your Qlik Sense dashboards
Filter Extension for Qlik Sense: What is a Filter?
A Filter is a control mechanism for displaying a selection of data. It helps the user minimise and focus the data on their screen when handling large data sets.
A common use of filters is to display data combinations on a dashboard. They make it easy for the user to decide what data they want to see and how they want it displayed. Users can view what interests them by choosing attributes such as date, numeric value or age and filter the data with the attributes they’ve selected.
Taking a more in-depth look, data filtering involves removing rows or unnecessary information from a database. This redundant information could be viewed as ‘noise’ or clutter. A fundamental aim in data analytics is to reduce the noise so that data can be analysed easily. With the ‘noise’ levels down, the data can reveal clear patterns and trends that can lead to valuable business insights.
Filters help to reduce the noise by removing outliers or anomalies in a data set. The filters simplify the data and allow analysts to focus on creating a predictable data model. They get more reliable and trustworthy data this way. And executives get the right information to improve business process efficiency.
During the process of filtering data, the data is often ordered too. The output of the filtering process adds unique attributes or properties to the data. For example, in manufacturing, a filtered output may include part numbers and the date of manufacture. These attributes are a fundamental component in a data model and help data scientists to maintain data integrity.
Here’s a simple analogy – smart office workers using noise-cancelling headphones to block out the Christmas hits blasting from the office radio. Much like them, you can use filters to focus and navigate your data sets without unnecessary frustration!
How do data scientists use filters in different industries?
In the Healthcare sector, practitioners could use filters to drill down into specific data for focussed exploration like filtering a length-of-stay metric by gender or drilling down from leading diagnoses metrics into regions or facilities.
Data scientists in Financial Services may reduce financial data noise by filtering by unique financial years or to quickly review key finance data from the previous month.
The Retail sector often use filters to manage their sales like filtering by department or clothing age groups to assess if performance reached the target.
In the Manufacturing industry, executives may filter their databases to analyse the cost of goods sold and filter by product types.
High Tech companies need to track tickets and could filter their service delivery data by particular SLAs.
The government or other Public Sector entities can analyse financial data by filtering down from high-level views to drilled-down views such as filtering historical data by date range.
Energy and Utilities companies may serve a large area and would need to filter data by city or area to analyse output metrics.
Business intelligence leaders in Communications could choose to filter data by call location for new product research.
Life Sciences researchers may need to filter their vast genetic database by gene type so they can develop effective medicines.
Companies that manufacture and sell Consumer Products always need to streamline their supply chain and may filter data by supplier or price so they can deliver effective cost savings.
What is the Vizlib Filter?
Vizlib Filter is a highly-customisable filter component for Qlik Sense. And it works perfectly with the powerful Qlik Associative Engine. Together, you have the ultimate tool for database searching, querying and filtering. And at supercharged speed! The extension makes it easy for users to select data in a data model and control the data effectively.
The user-friendly design will enable you to manage and present data fields effortlessly.
How can Vizlib Filter improve your data modelling?
Vizlib Filter is the tool you need to handle big data and create reliable data models. The intuitive extension will enable you to build compelling dashboards for your users.
You could use the following Vizlib Filter features to improve your data output:
-
-
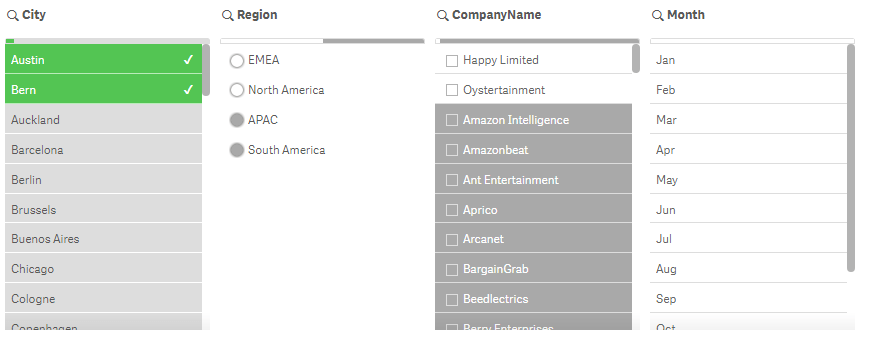
- High level of interactivity: Direct the extension to create the filter design and functionality you need. You can even choose between three different component types: Listbox, Dropdown or Buttongroup style to suit your data model.
-
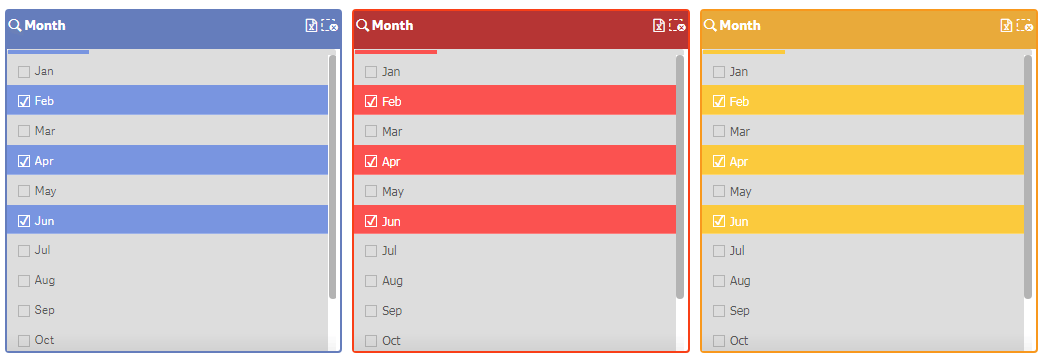
- Custom styling options: Select the styling and position of your filters that will keep the model simple and communicate best with your audience. They’ll get the right insights at a glance and not be overwhelmed by data noise.
-
- Easy export options: With the Vizlib Filter, it’s quick and easy to export your data to Excel, saving you time.
-
- Responsive design: Adapts to any screen size and ensures continued productivity on any device. Your Listbox even transforms automatically into a Dropdown when the screen size is reduced, allowing you to continue navigating the dashboard easily.
-
- Application of multiple Actions: You can select multiple Actions, like Select Alternative, Forward, Backward or Lock Field after applying a selection. And, since the Actions are easy to access through right-click functionality, you can save time and focus on developing an effective dashboard.
-
Viztips: The power of visual analytics on hover
Viztips is a next-level capability for Vizlib Library that enables you to insert customised, dynamic charts in your tooltips. Include Viztips with Vizlib Filter to add additional insights without adding clutter to your visualisation. Your end-users can get granular level data on hover, without being overwhelmed by too much data. Since Viztips consists of two components; your main Vizlib chart and a Vizlib KPI Designer Layer, you can include up to 10 custom layers in your Viztip design!
Filters are an essential element for managing data and gaining the insights your business needs. Though it may be difficult to avoid overly cheerful festive season anthems inside your local supermarket, you can cancel out unwanted data noise with the help of user-friendly database filters.
Learn more about the Vizlib Filter here.
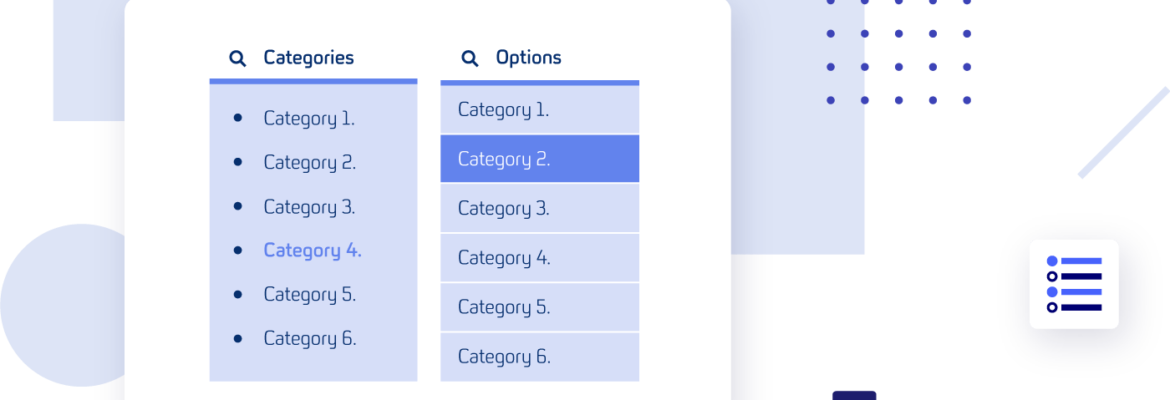
Here are a few examples of the Vizlib Filter.
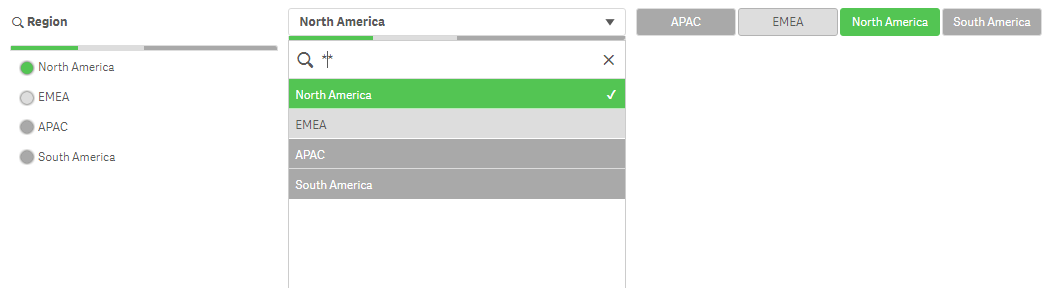
![]()