Vizlib Pivot Table: How to use a Pivot Table in Qlik Sense

Pivot Table Extension for Qlik Sense: What is a Pivot Table?
A Pivot table is a table of summarised data extracted from a database. It is a data processing tool used to summarise, analyse and compare data. It enables the user to pivot or rearrange the data and view it according to their needs. Users can change rows into columns or vice versa, or isolate or expand data to get the best perspective and draw attention to key data points.
The best use of the Pivot table is to aggregate and analyse large amounts of data. Since the user views only a few data fields at a time, the layout facilitates easier engagement and analysis. Executives often use this data processing tool to calculate averages or sums like sales by region, or to generate specific values like sales by country.
The ability to summarise data quickly and easily allows users to create real-time reports and gain the exact business insights necessary to shape strategic growth. The dynamic Pivot table is more than a trusted sidekick. It’s all in the name—it’s pivotal!
How are business leaders using Pivot tables?
The Pivot table is an essential tool for industries that generate and manage masses of data. They need to extract meaningful insights quickly. And their success relies on the table’s dynamism to pivot core data.
In the Healthcare sector, Pivot tables can help with practice management. They could be used to monitor referrals or patient reimbursements.
Finance practitioners use Pivot tables to prepare income or financial statements or even to analyse the stock market!
Retail is all about sales. A Pivot table is a great way to track sales and profit data or to drill down to specific metrics like number of days versus number of orders delivered.
Pivot tables are a fundamental reporting tool in Manufacturing. Decision-makers may create a Pivot table for their daily production report or specific product reports to help manage inventory. They may also use Pivot tables to assist in purchasing planning.
Energy and Utility providers measure information like energy consumption per user with Pivot tables.
In the Public sector, governments may use Pivot tables to manage trade statistics. Schools often use them to track information like education level by gender.
In Life Sciences, Pivot tables help organisations manage data like immunisation coverage by country.
What is the Vizlib Pivot Table?
Vizlib Pivot Table extension for Qlik Sense is the Pivot table for agile-thinking leaders who need insights quickly. The user-friendly extension allows executives all the functionality they need to slice and dice data.
Getting the most from the Vizlib Pivot Table
Executives need tools to generate valuable business insights and strategise for business growth. Employing the Vizlib Pivot Table provides users with access to:
- Full control over the interactivity at all levels on the extension to create purpose-built Pivot tables.
- Dynamic components that allow you to pivot the data easily to meet your changing business needs.
- The Ad Hoc Pivot Table feature to create an ad hoc Pivot table. A fast way to build up a Pivot table on the fly.
- Easy accessibility since you can save the whole dashboard view with its formatting as a bookmark and access the exact table again with one click. A great time saver!
- Different icons for indicators to emphasise particular figures and make the dashboard more personalised and engaging for viewers.
- Quick exporting options that maintain the same formatting enabling you to merge your BI data with your internal processes smoothly and quickly!
- Intuitive options like opening on ‘the most recent data’ for greater task efficiency.
- Better UX with the ability to highlight on hover. You can adapt the data focus for the right audience.
- User-friendly functionality like showing or hiding dimensions supports easy table navigation.
- The Wizard feature to dive in quickly and get the insights you need!
Tip: You can save your current Vizlib Pivot Table configuration as a bookmark for quick, easy access!
The Vizlib Pivot Table is an agile extension that allows users to view data from the right perspective at the right time.
Learn more about the Vizlib Pivot Table here.
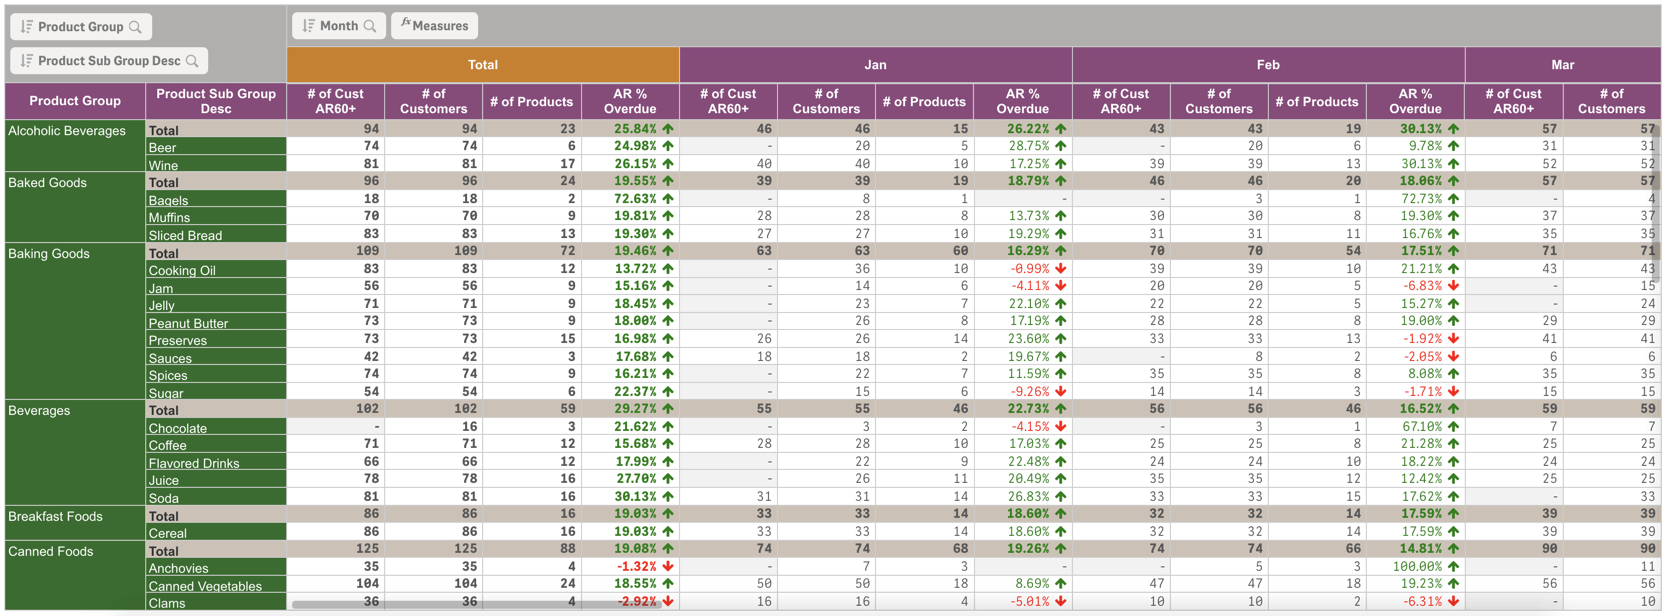
Below is an example of a Vizlib Pivot Table for P&L calculations.
Ad-Hoc Pivot Table using conditional show/hide
P&L Table
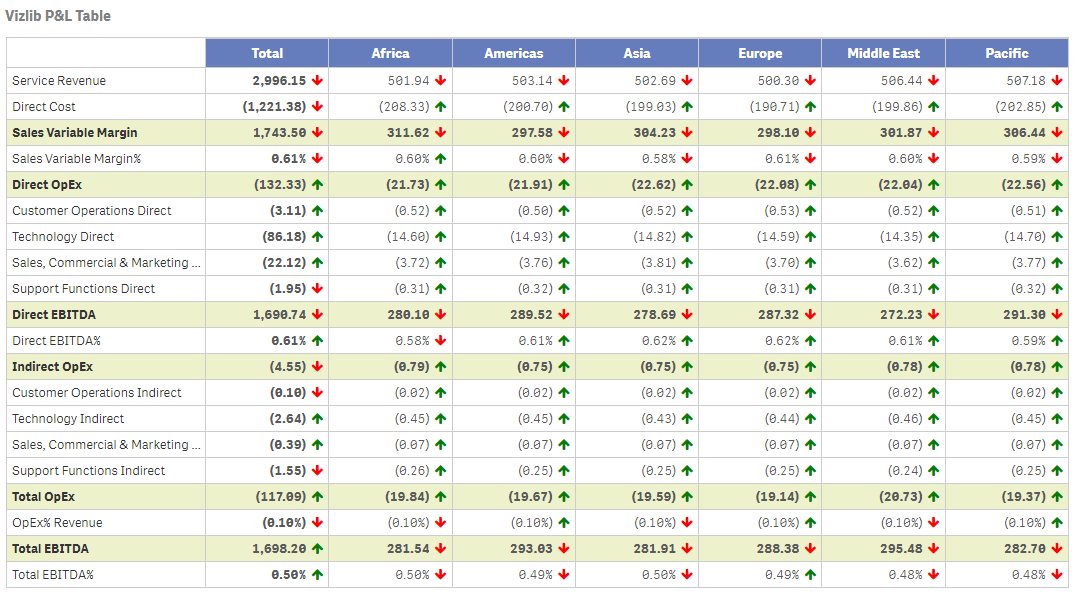
Measure Indicators
![]()
Rich Formatting Options