Vizlib Slider: Using a range slider to create interactive dashboards in Qlik Sense

Slider Component for Qlik Sense: What is a Slider?
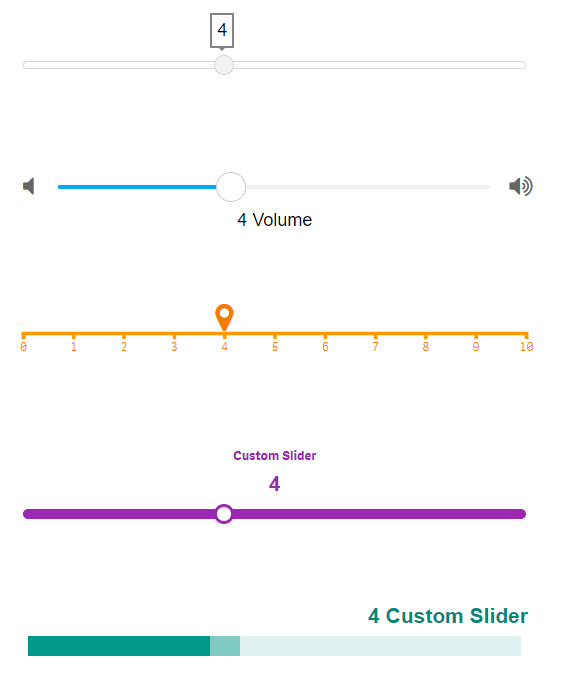
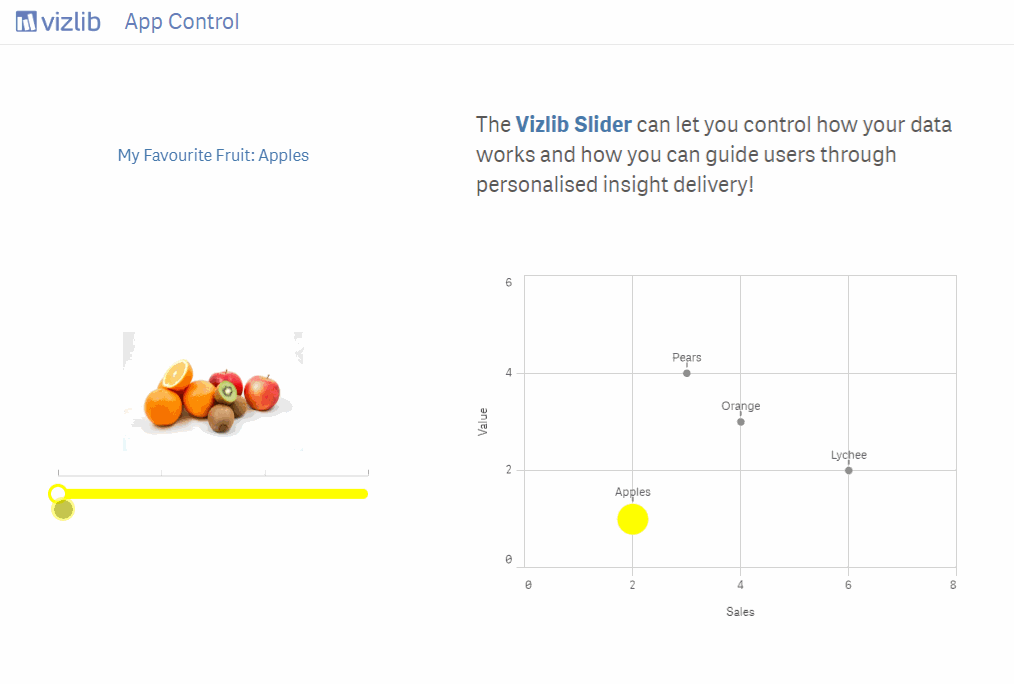
A Slider component is a visualisation input tool which reflects a range of values displayed along a bar. Users select a single value with the Slider, often to adjust the degree of a setting like volume, brightness, or to apply image filters.
A Slider is a beneficial data visualisation tool as it allows users to explore a wide range of options quickly. It can help them make a decision faster as they can view options and put them in context quicker. It’s also used as a toggle to turn a single setting on or off. Changes made with Sliders are immediate, allowing the user to adjust the Slider until they spot their preference visualised.
It provides users with an easy way to explore options in more depth. If you want user input to encourage exploration, the Slider is an excellent choice. It’ll bring out the Indiana Jones in users and get them diving through your data visualisation as though they’ve just uncovered a long lost temple!
How do managers use the Slider in different industries?
In Healthcare, practitioners use the Slider to measure the patient satisfaction rate or to track the operational targets of hospitals.
The Slider tool is widely used in Finance organisations. Sliders help users choose a down-payment range for a mortgage or quickly calculate the monthly payment of a home or vehicle loan. The Slider visualises the financing options and the cost of a house or car or initial down payment, making it easy for the user to select the option that best suits them.
In Retail, analysts can review sales by adjusting the order date on a slider to filter data results.
Sliders feature in High Tech companies for filtering product sales by region or date.
Many Energy and Utility companies use a Slider to filter their data by energy type.
In the Communication sector, a Slider helps practitioners filter their ROI on campaigns by date to establish what efforts were successful.
Public sector organisations use Slider controls, for example, as an input tool for the number of children in a household.
Sliders help researchers in Life Sciences limit or extend the geographical scope of their search on a map.
In Consumer product organisations, managers use Sliders to control sales targets. Or the Slider tool allows users to explore a product by filtering the options by the functions or features they need.
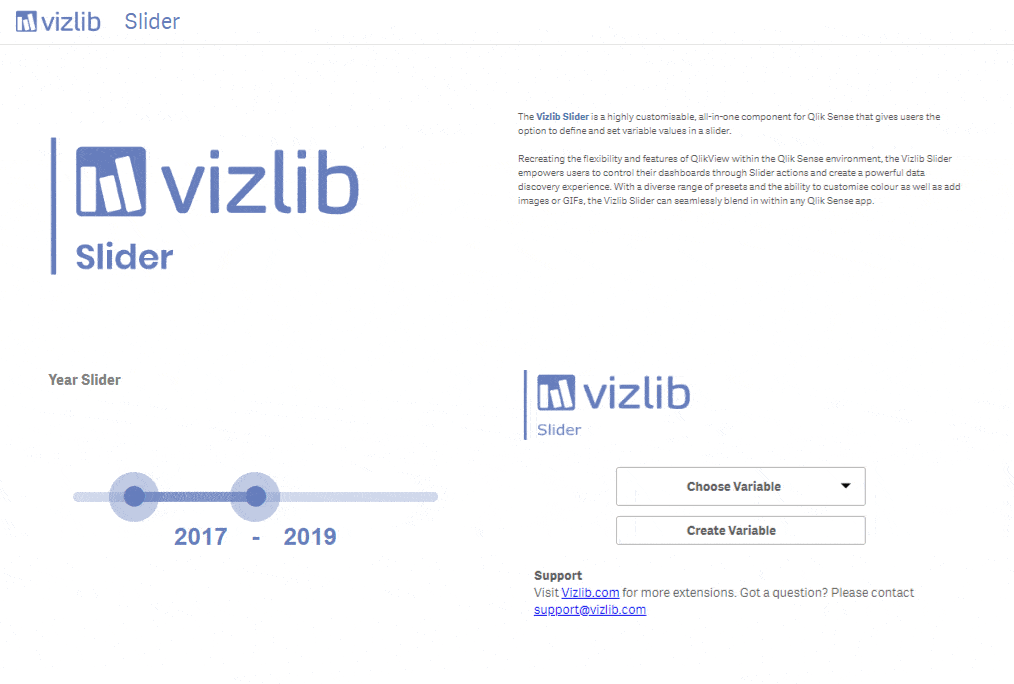
What is the Vizlib Slider for Qlik Sense?
Vizlib Slider is a highly customisable component for Qlik Sense with rich formatting and styling options. It provides users with the power to control their dashboard easily through Slider actions.
Vilzib Slider enables you to design powerful data discovery experiences with features such as:
- Define and set variable values in a Slider to manage the data options you display.
- Diverse range of presets with predefined Slider styles to save you time in creating your visualisation.
- Personalisation: Add text, images or GIFs to add the personal, branded touch to your dataviz.
- User-friendly wizard: Getting you from start to finish with your ideal Slider quickly.
- Tooltips: Adding the context your users need for sound decision making.
- Customisation: Of colours and tools like the Slider bar to match the styling of your dashboard.
Vizlib Templates for Vizlib Slider
Vizlib Templates is a capability that can help your data users create, save and share custom Slider designs quickly. The new feature speeds up the development process as you can select and apply previously designed and saved pixel-perfect templates. And since you can share approved template designs with your team, it also enables your company to generate a consistent, professional look across all your Qlik Sense apps. You can find out more in the full documentation here.
Sliders help your audience hone in on their selection of the data story. They can choose their own visualisation adventure and be the hero through their quick-thinking decisions and actions.
Learn more about our data discovery champion, Vizlib Slider here.
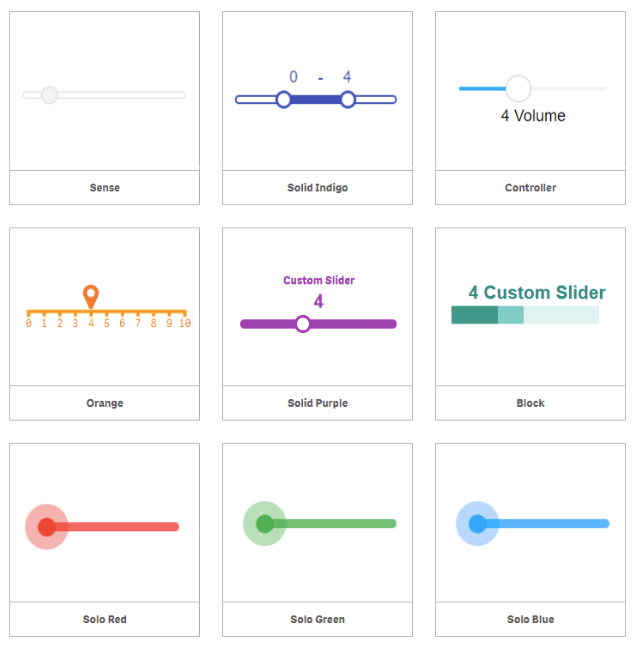
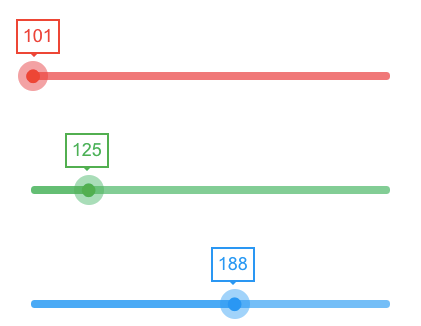
Here are a few examples of the Vizlib Slider component: