Guided vs. Self-Service Analytics: which BI system does your company need?

The power of choice is essential in times when everything’s turned on its head, including data models.
BI managers must scramble to keep the data pipeline agile and continually push for more business value. A major kickoff point is choosing the right BI system—one that drives user adoption, enhances efficiency, generates acceptable ROI, and boosts business value. Questions that often arise in this decision-making process include what level of coding will the solution require, does the software integrate easily with other business capabilities, and is the software scalable.
For help in reaching the best conclusion, experts recommend that business leaders create a wish-list of their technology requirements. And then have their data science team find solutions that meet those needs.
To streamline this process and your overall decision, let’s look at the role guided analytics and self-service analytics fullfil in an organization.
What is Guided Analytics?
Guided analytics is an analytics solution that is created by a developer, based on a particular business requirement, such as reducing customer churn. It works best for well-defined tasks, including root cause analysis, and uses out-of-the-box capabilities to guide the user’s path as they explore structured BI reports.
Let’s look at it as a game for those gamers out there. Say the user is playing a linear video game, like Mario Bros (come on, we know you loved Mario!). They want to collect as many points or tokens as they can to get to the next level. Their goal, and the path they’ll take to reach it, is pretty predictable, right?
Now, in guided analytics, you’re predicting the path the user takes and steering them down a particular route, with the assumption of what questions they will be asking along the way. Users start with high-level questions, like why did our sales drop. To answer that you need to ask what product sold the least and what region sold the least. Then ask which team/salespeople sold the least, was anybody ill or other HR-related questions, were there holidays or unplanned closures, for instance. The walkthrough process of asking and answering these questions defines guided analytics.
You’ll find that successful guided analytics solutions usually include these four basic characteristics:
![]()
Open: an open environment where business users and data scientists don’t have restrictions on the tools they can use to collaborate.

⚡ Uniform: a uniform environment that is agile and intuitive.
![]()
⚡ Flexible: ‘under the hood’ the application should be flexible enough to run thousands of models.
![]()
⚡ Agile: the ability to quickly adapt the apps to new business requirements and not miss out on opportunities.
Benefits of guided analytics
Guided analytics can save the user time. They don’t need to create anything from scratch, and can dive in, explore and analyse reports quickly and easily.
This approach also helps to keep data flowing in an organisation, often resulting in greater business value. Human feedback and guidance should alter the course of the data flow so that all data users, from data scientists to end-users, gain value from analytics.
Another benefit of guided analytics is that it keeps experts in the driver’s seat. Guided analytics attempts to automate expert data skills. Then, not only data scientists and analysts benefit, but especially business users.
Lastly, users can explore the full data set safely, given that the data and metrics are often predefined. And this secure data environment boosts their confidence and curiosity to extract the actionable insights they need to support their decision making.
Vizlib Library offers highly customisable dataviz for all your guided analytics needs
Guided analytics use cases
Sales, finance, marketing, IT, operations and HR all study trends and try to understand them. They might spot a peak in a month-on-month chart, which will spark further questions such as why did sales fall or which product, region or team sold the least. These are all valid questions which a guided analytics solution can easily answer.
Sales
Guided analytics can help you spot the deals that are likely to close. Drill down and unlock the insights contained in your sales data to establish what contributed to your wins and easily replicate them.
Finance
Extract additional context from your financial reports and get the insight you need to drive revenue. With a single version of truth, you can make informed decisions that generate real value.
IT
Be proactive in your IT approach. Leverage guided analytics to find and handle the root cause of issues. You’ll free up your time for higher-level tasks.
Operations
Gather the right data to streamline processes and enhance operational efficiency. Get the key insights you need for agile decision-making that helps reduce costs.
If you’re interested in seamless workflows, where users can navigate through their data, question after question, with tailored views, take a look at Vizlib’s guided analytics capabilities, like Vizlib Actions.
Vizlib Actions enables users to make seamless selections, create custom buttons, simplify and speed up the flow of data between apps with API integration, export data easily, apply bookmarks to save time and collaborate smoothly.
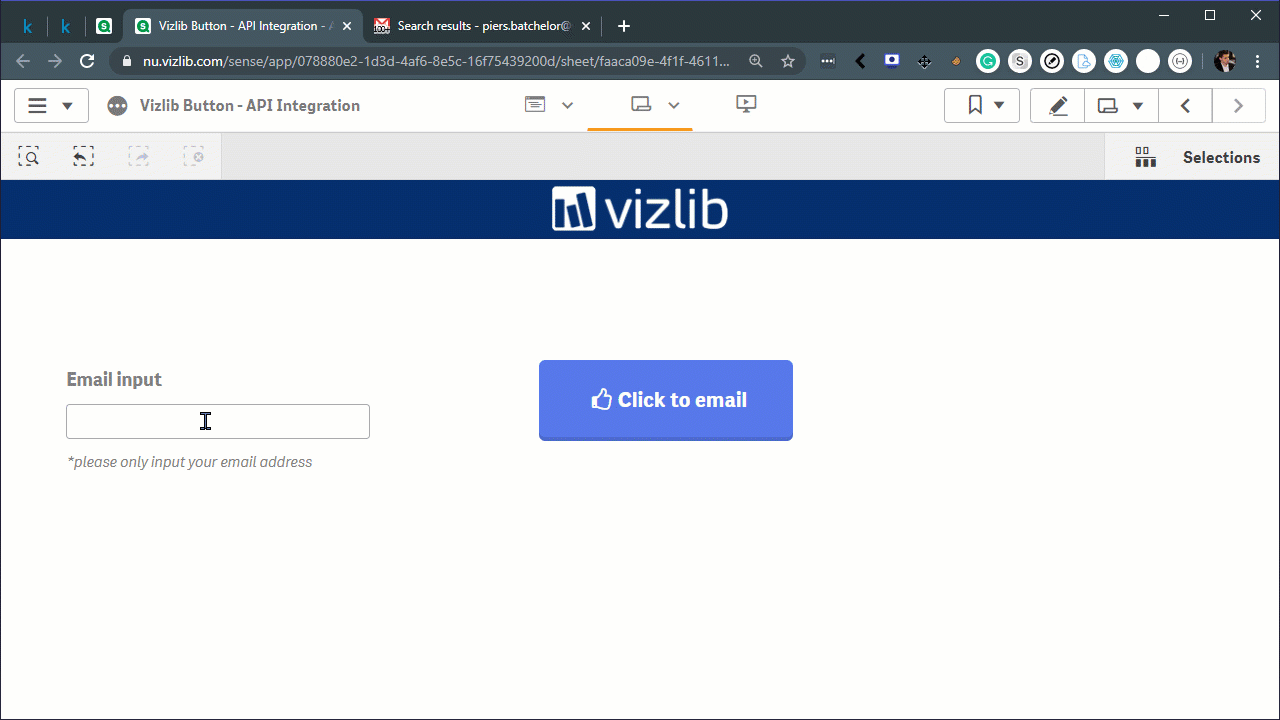
Vizlib Button combined with Vizlib Actions establishes a guided analytics experience, which empowers users to easily link with apps like Zapier and Slack, create efficient shortcuts, navigate the app better and discover insights with ease in Qlik Sense.
What is Self-Service Analytics?
Self-service analytics enables all users to perform ad hoc analysis, queries and create reports on their own. It transforms users from consuming reports constructed by data scientists, to consuming data—getting to the Why behind the data and revealing previously undiscovered insights. Users don’t need a background in stats or data science to uncover these insights. With a focus on a smooth, intuitive user-experience, self-service solutions often employ easy-to-use components like drag and drop functionality to engage all data users.
So, what does that really mean? Let’s say you’ve developed a taste for poke bowls (traditionally a Hawaiian marinated fish and rice appetizer). And there are two restaurants in your town that offer this speciality. The one has a menu that offers many 20 great poke bowl dishes, but you can’t mix and match or select exactly what you want included in your bowl. Since the choices or dishes are predetermined, it’s likely that you wouldn’t want them exactly as is (maybe the dish you fancy includes wasabi and you don’t want wasabi, as crazy as that sounds!).
Now, the other establishment lets you select precisely what you want in your poke bowl with 5 simple choices – your base ingredients, the protein you want, any specific extras, and the sauce you’d prefer. You get to create an original dish that suits your preferences. There’s more flexibility and, instead of reading through a long list of 20 dishes, you only need to make 5 simple choices.
Similarly, self-service analytics offers the user simple choices and gives them more flexibility in their data analysis. They can access, analyse and report on the data they select. They’re no longer obliged to choose between predetermined options created by a data team.
With the right user-friendly BI tools, they have the autonomy to choose their own ‘poke bowl’ components, and with simple choices, develop their own reports and uncover previously hidden insights!
Benefits of self-service analytics
elf-service solutions enable business users to steer their own data analysis. They don’t need to understand the underlying programming. Since little or no coding experience is required, self-service helps to bridge the gap left by a shortage of trained data analysts.
Another benefit is that users can get access to data without long delays. Business users have the biggest need for data to support agile decision-making. If they have to rely on IT or data scientists to generate reports, they could miss out on business opportunities. Self-service analytics enables them to make real-time decisions based on their own reports and analysis.
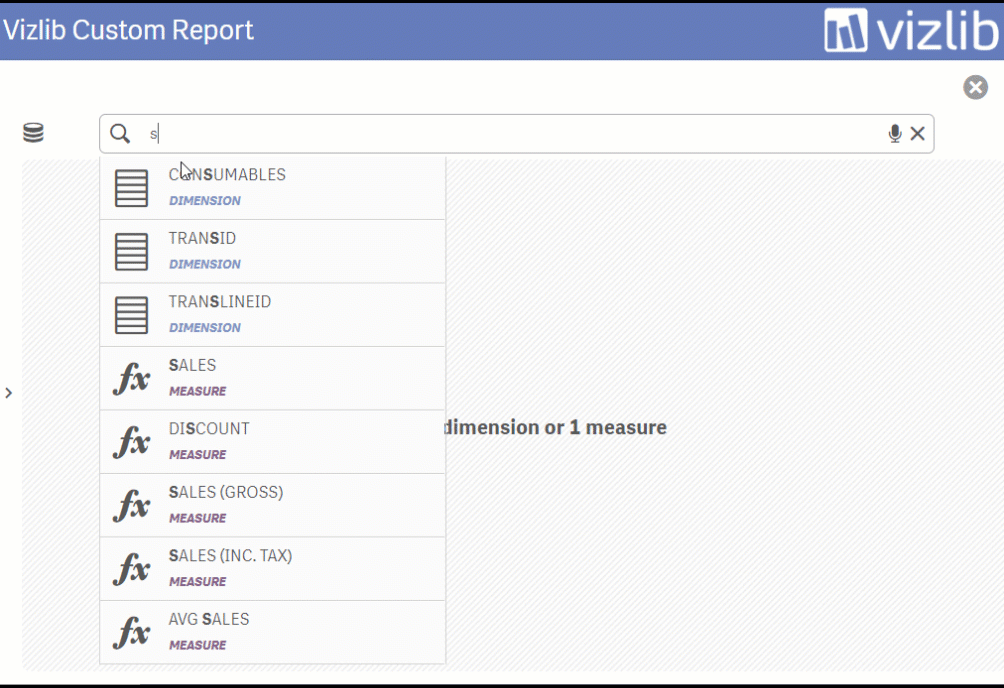
Vizlib Analytic Search for Vizlib Custom Report provides fast, easy access to data and even has voice-search functionality
The advantages don’t end there. Self-service analytics also helps to bring together dispersed data in an organisation. It can break down data silos and stitch together fragmented data sources, as all users access a single source of truth. The resultant insights can then be easily shared among different departments.
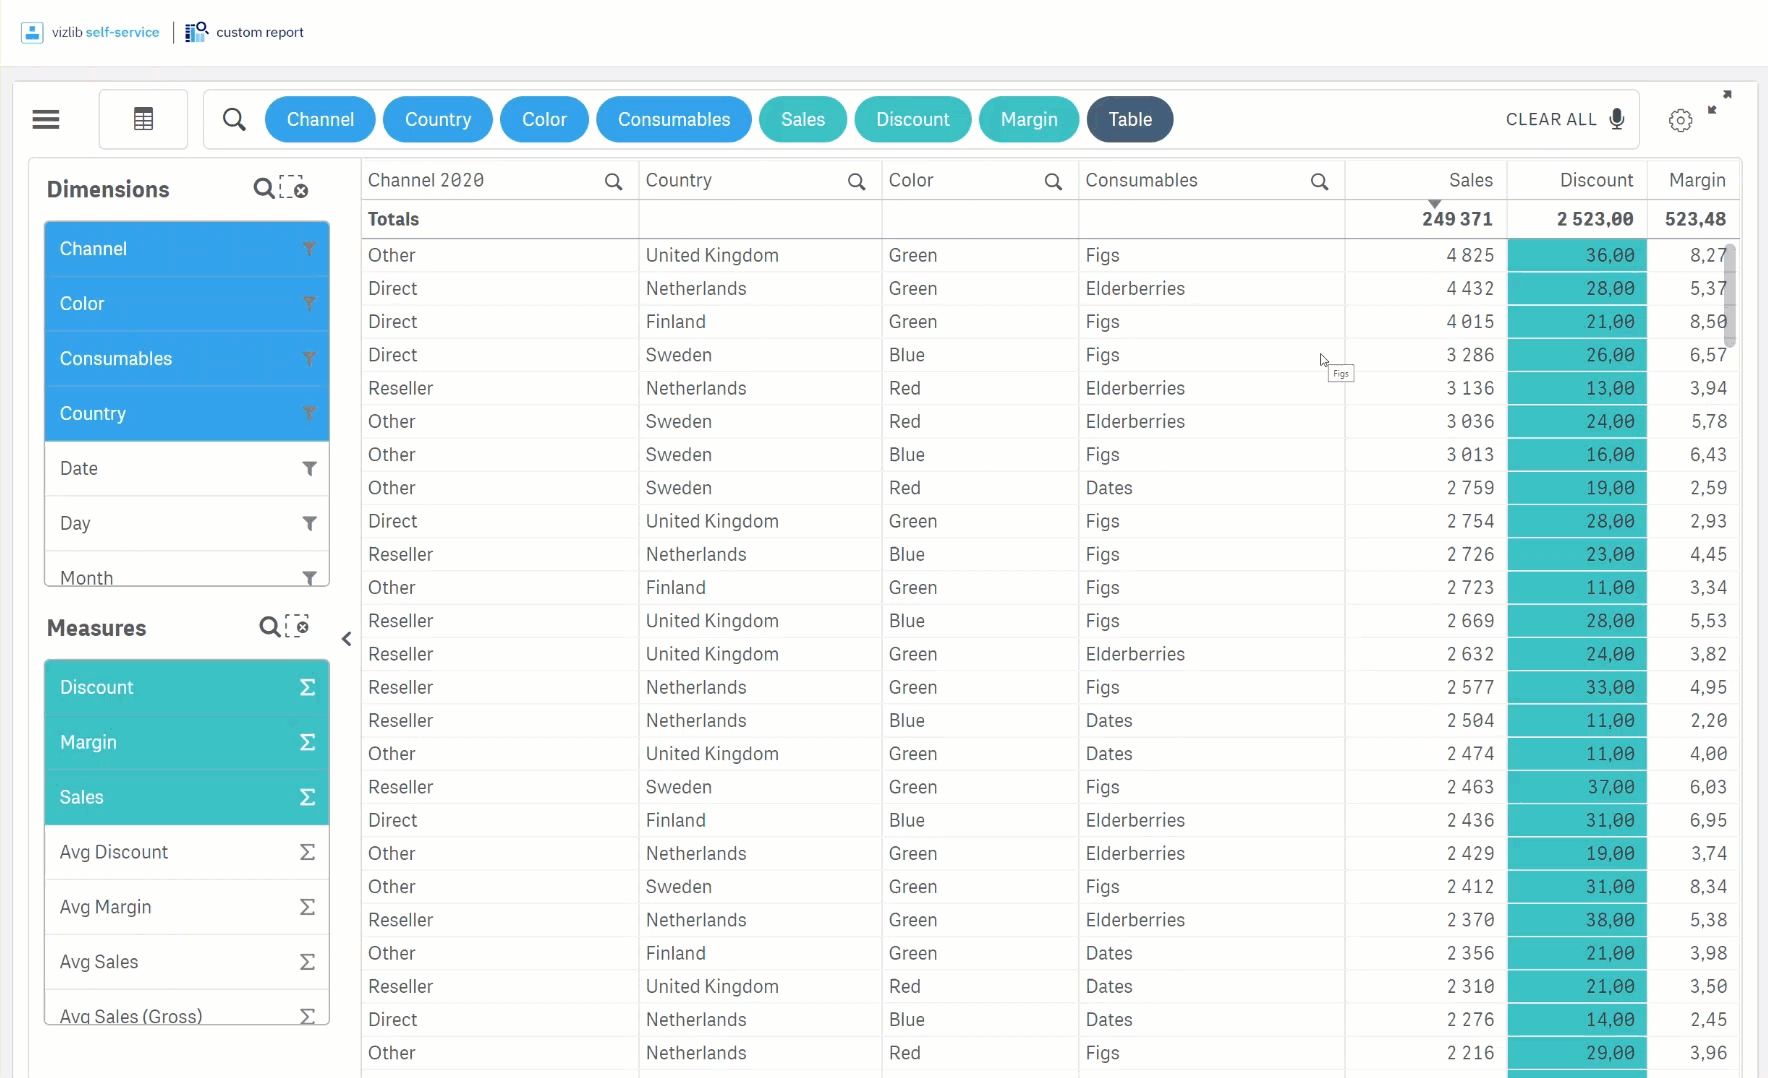
Vizlib Custom Report for Vizlib Self-Service easily enables users to switch dimensions, measures and visualizations
Self-service analytics use cases
Healthcare
Self-service solutions enable healthcare professionals to directly access, analyse and process patient data quickly. Effective solutions automate the process of accessing, preparing, analysing and reporting, resulting in improved and timely diagnosis and treatment outcomes.
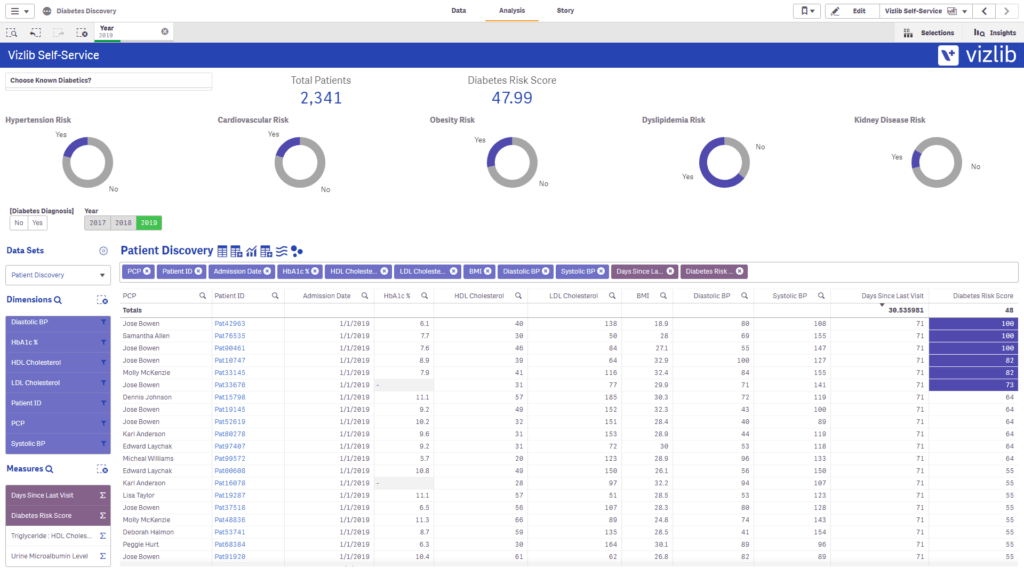
Vizlib Self-Service Diabetes management dashboard
Manufacturing
Many manufacturers employ self-service solutions for real-time monitoring. It enables them to streamline the production of vital products, like medical supplies, and boost employee safety. (Learn more about solving everyday manufacturing problems. )
Marketing
Filtering leads or deals for actionable data is easy with self-service solutions. Marketers can gain a better understanding of their customers and meet their needs more precisely.
Finance
In the financial sector, self-service platforms help to overcome the issue of data silos through integration tools. It speeds up analysis as the data is already prepared and doesn’t require any outside assistance. In the end, the customer wins, with accurate and timely advice.

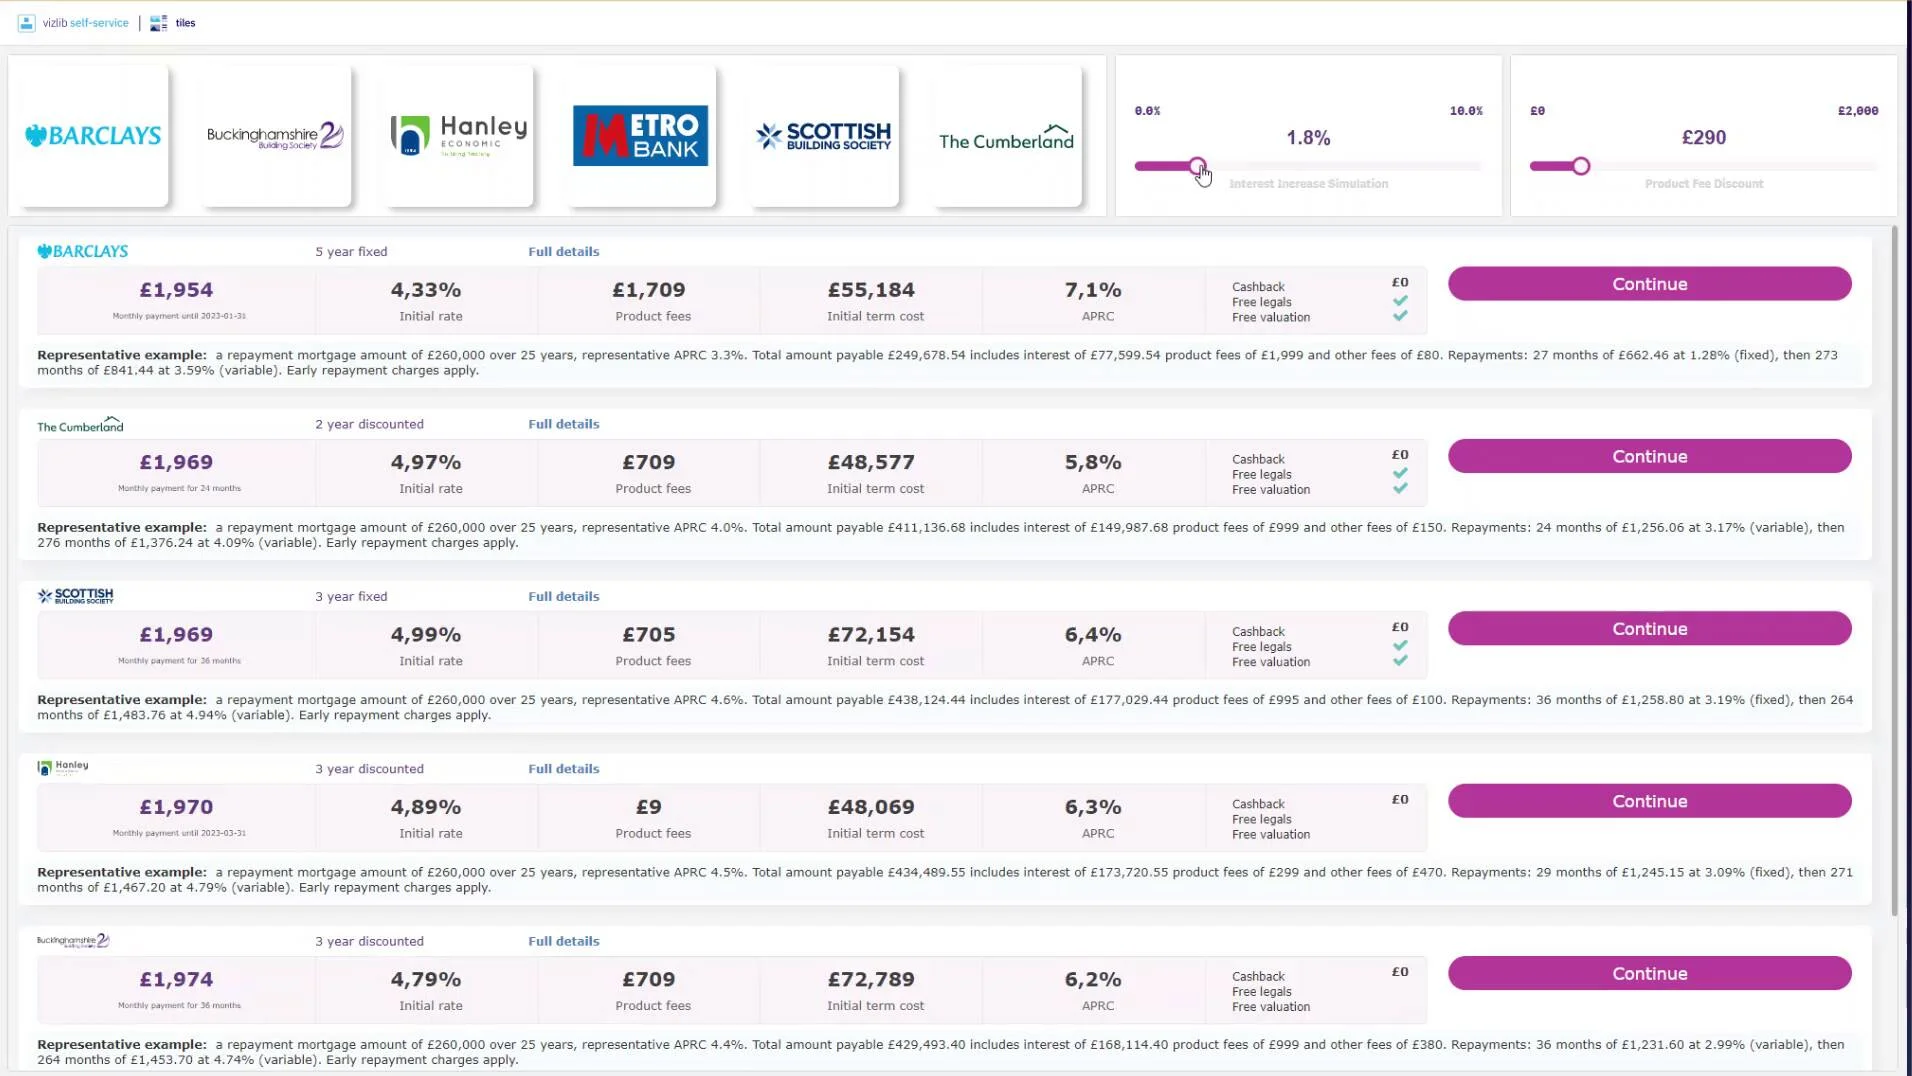
Vizlib Tiles, part of Vizlib Self-Service, provides a quick tile-style visual summary of how interest rates affect mortgage calculations
Pro tip: To get the greatest benefit from self-service analytics, it should be supported by a solid data governance strategy.
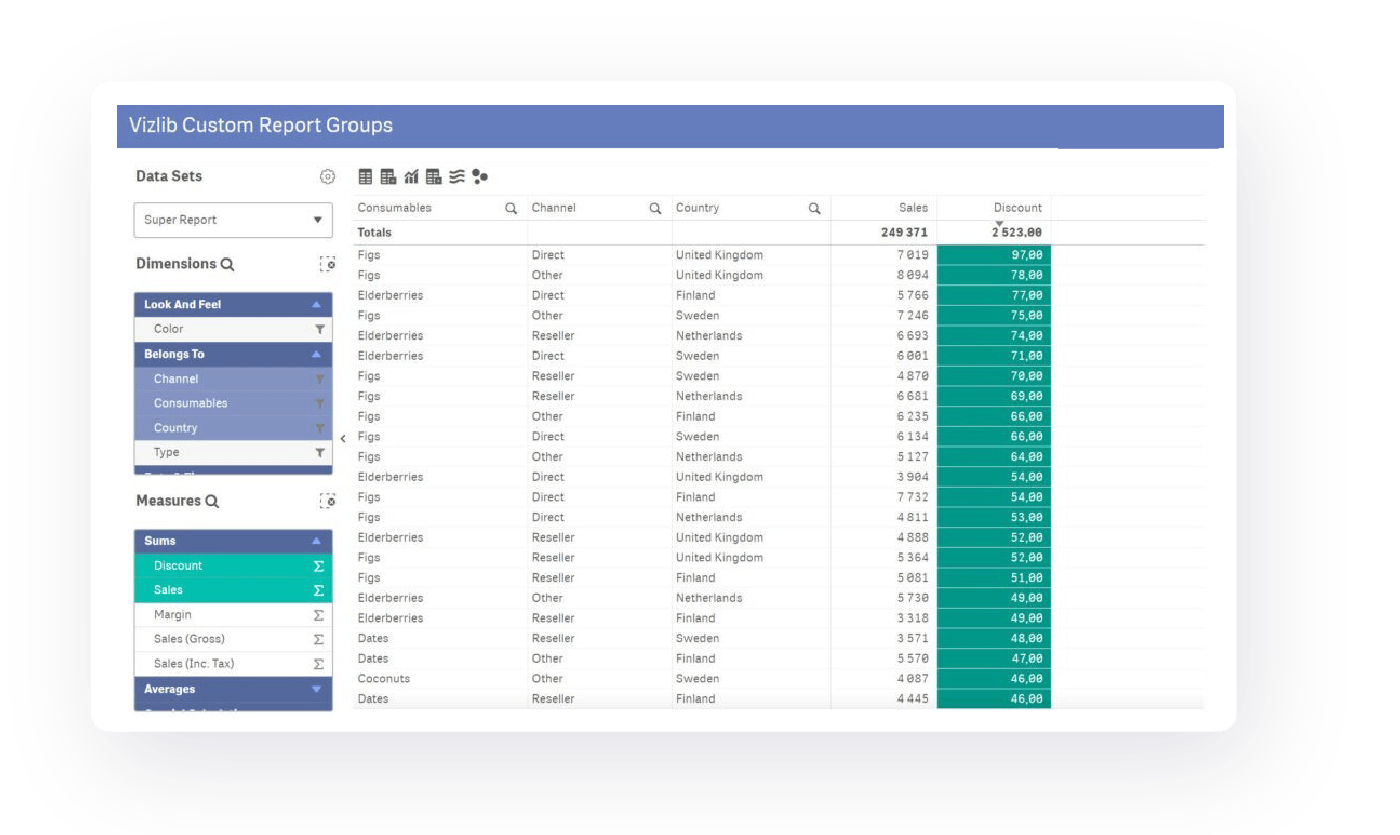
Vizlib Custom Report for Vizlib Self-Service
To get the best ROI from your chosen BI solution, make sure it’s easy-to-use and intuitive. The platform should enable all data users to analyse data easily and confidently, break down silos for smooth insight-sharing and promote a data-driven culture.
Discover how to combine the best of both worlds and bridge the gap between guided analytics and true self-service to close the analytics loop—take a look at Vizlib’s new writeback capabilities in our reimagined Vizlib Collaboration product for Qlik Sense.