Tackle Your Most Challenging Finance Reports and Gain Visibility into Branch Performance
How Easily Can You Access Data to Tackle the Complexity of Finance, Banking, and Insurance Reporting?
Creating Complex Reports Like Average Balance Sheets Takes Too Long
Evaluating critical KPIs like average balance sheets, branch profitability, and outstanding loans requires time-consuming static data dumps into Excel for formatting and manipulation. You need a more repeatable process that delivers faster visibility into the KPIs to keep track of the health of your business and branches.
Answering One-Off Questions Takes Too Long
Responding to questions about average deposits, loans outstanding by officer, and interest income is a time-consuming, manual process when the need for answers is urgent.
Distributing the Right Information to the Right Individuals Easily is a Struggle
Without an easy way to distribute reports to branch managers, department heads, and other leaders, this becomes a tedious, manual process that takes time away from other critical tasks. Once the reports are distributed, the data are static and out of date, and recipients lack the ability to drill into the data to answer the inevitable questions that arise.
Adapt to Changing Regulations and Market Conditions
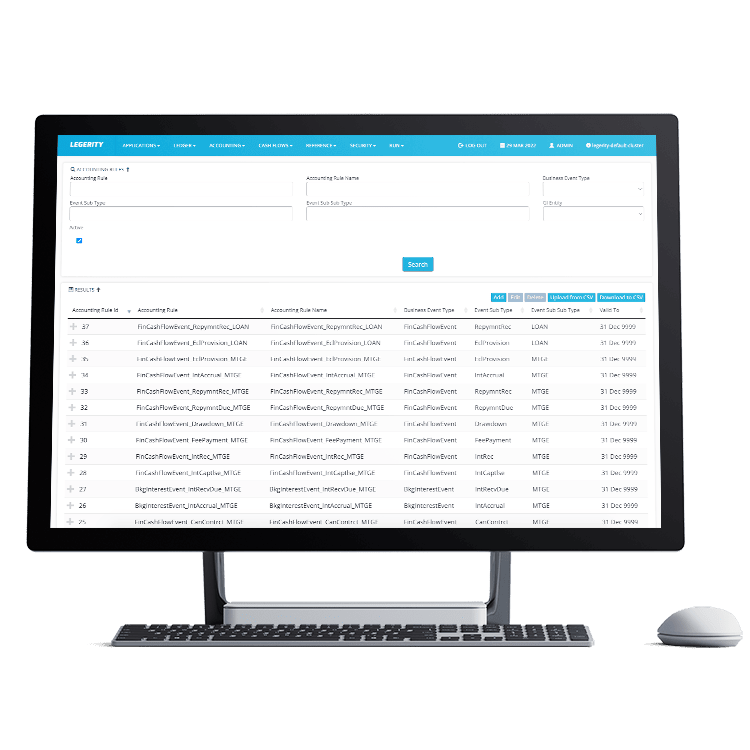
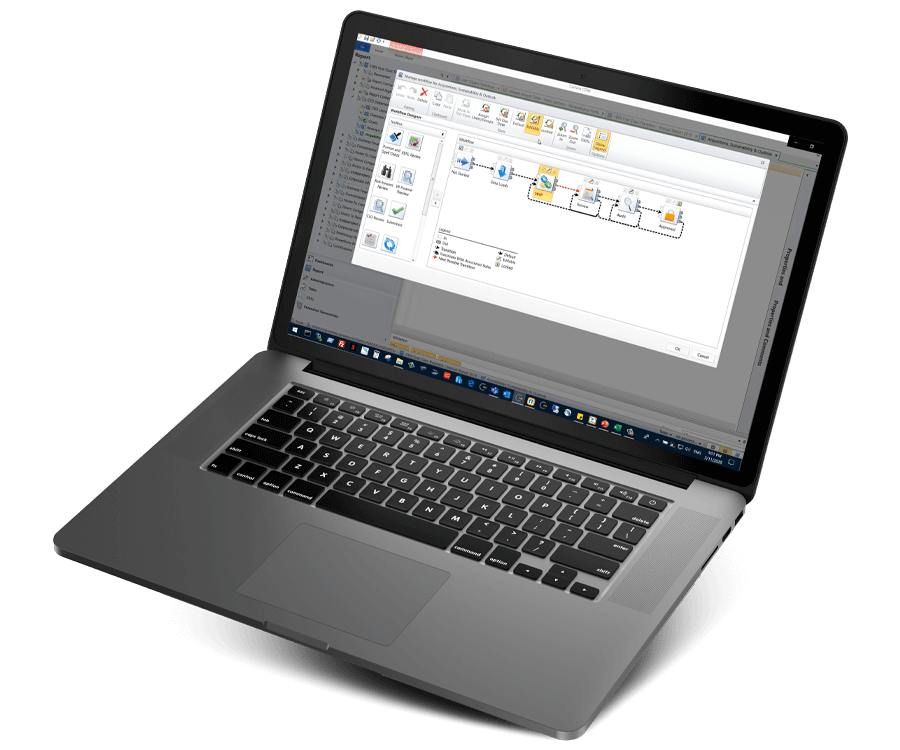
Achieve compliance, such as IFRS 15 or IFRS 17, quickly with out-of-the-box configurations. FastPost addresses regulatory challenges by enabling you to capture the financial information associated with any transaction and classifying it according to your accounting rules.
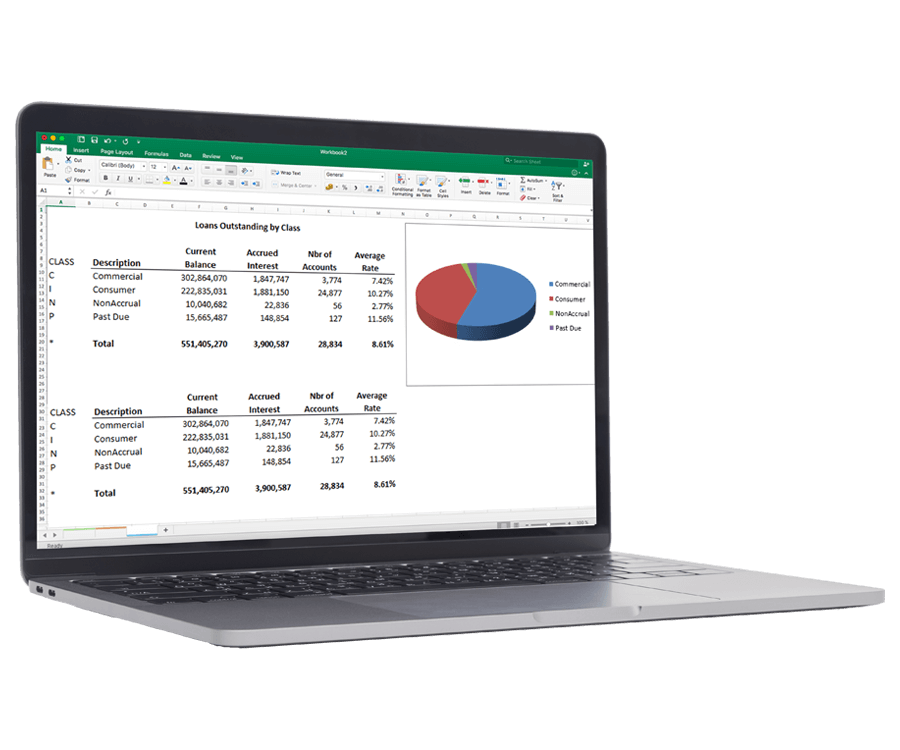
Accelerate Challenging Banking Specific Reporting
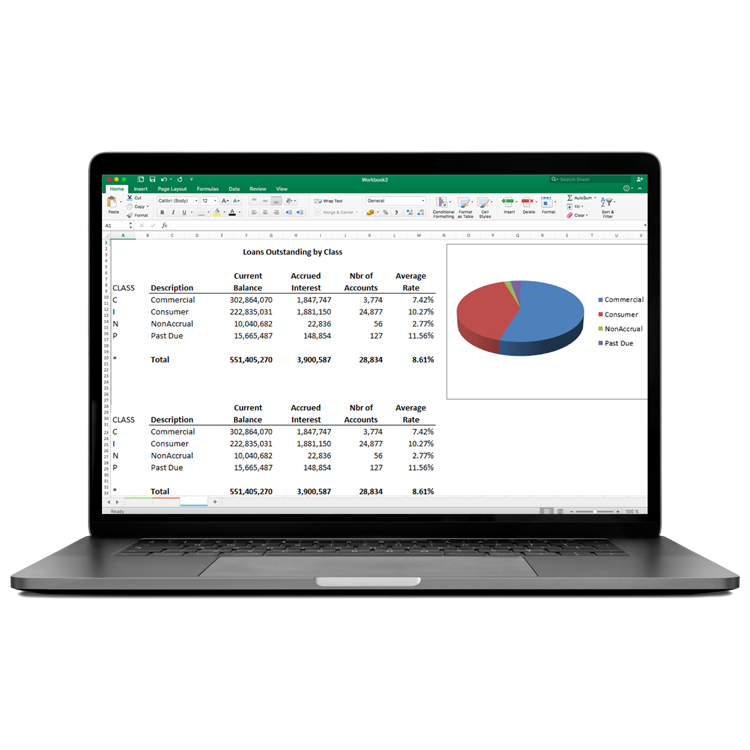
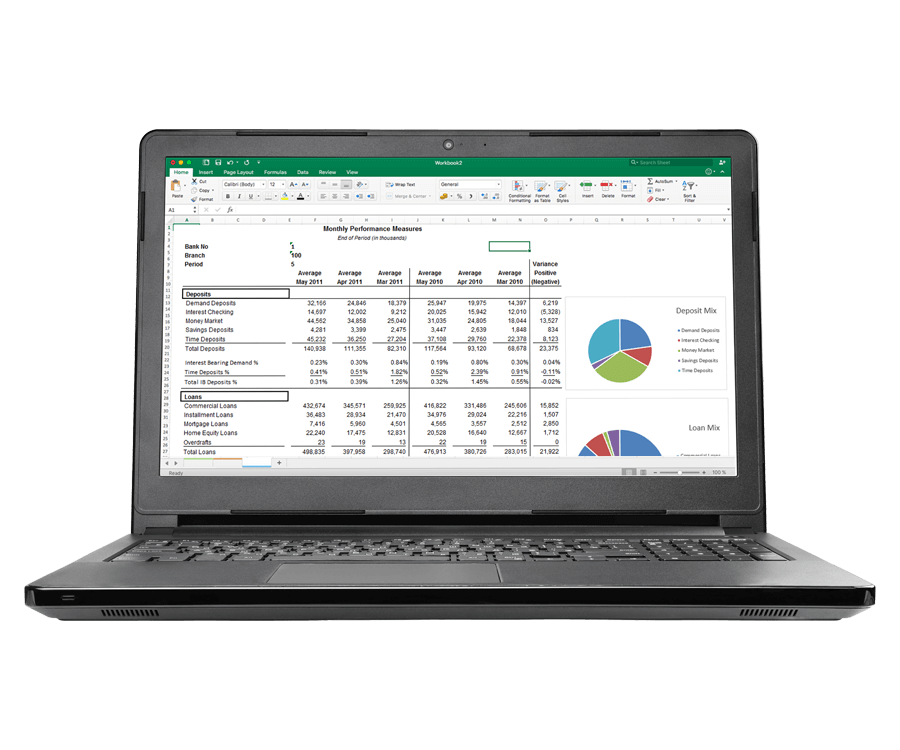
Whether you are using FIS, Oracle E-Business Suite, SAP, Sage, MRI, or Microsoft Dynamics, you can quickly and securely create the reporting you need with insightsoftware. Easily create refreshable reports that tackle your most complex needs that currently require multiple exports. For example, create average balance sheets showing only the data you want to see, reports to help you reconcile your income statement to your tax return, apportionment of income for state tax purposes, and more.
Create Real-Time, Drillable Reports for Your GL and Beyond
Enable the finance team to build refreshable reports using easy-to-configure, pre-built templates, or by creating a custom report in minutes, without help from IT or consultants. With direct access to accurate data from your CORE system, our financial reporting software understands the hierarchies in your CORE system, enabling users to drill into journals, balances, and subledger transactions to find and quickly fix reconciliation or data integrity issues. Go beyond your GL for pricing and HR data, and have a single source of truth for reporting on branch profitability, number of tellers, transactions per month, and easy loan yield calculations.
Tackle One-Off Questions with Ease
Create ad hoc reports on tax accrual by quarter, balance sheet with yield rate, and drill down into the information to answer questions from other departments and regulatory agencies. Create and format your reports exactly how you need them.
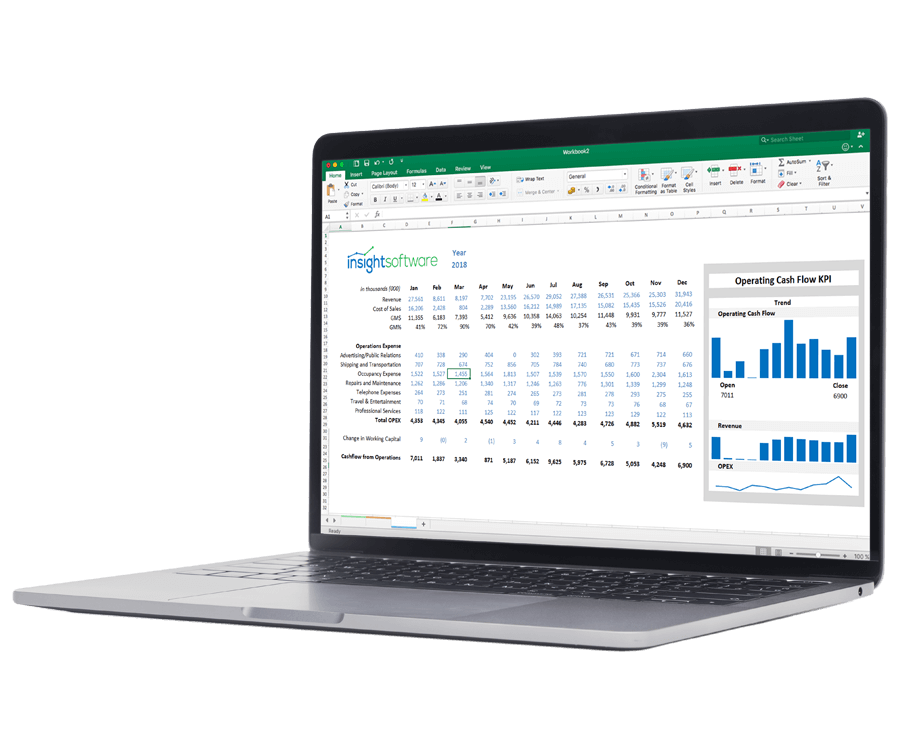
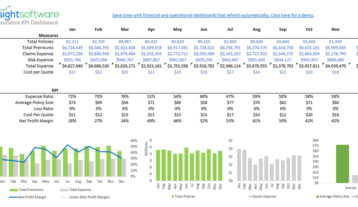
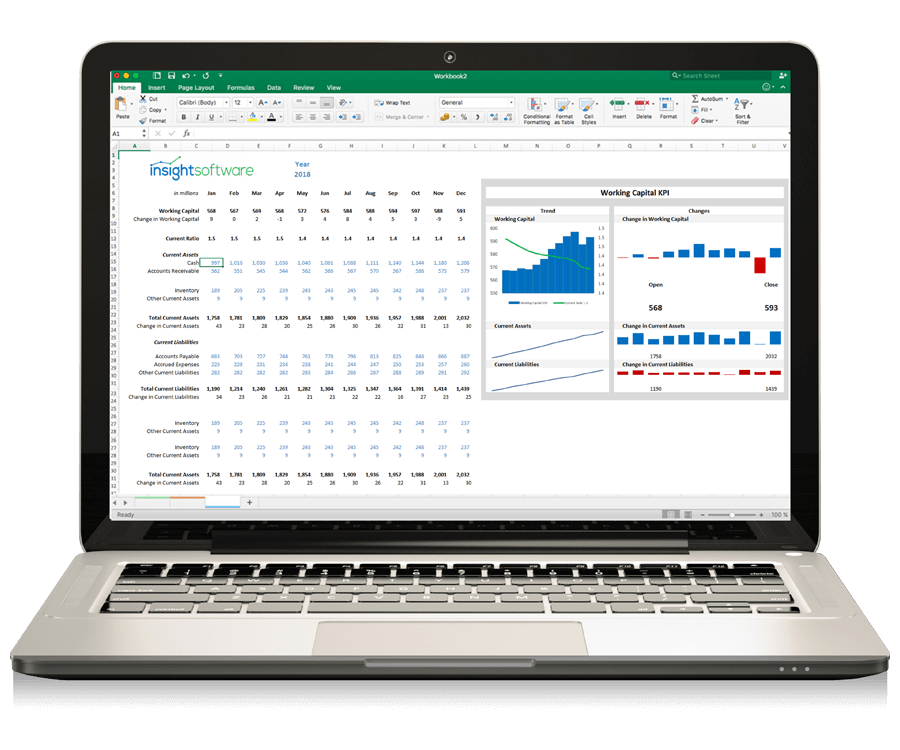
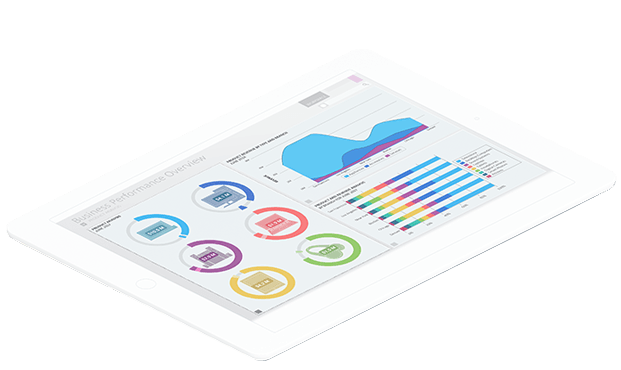
Help Executives and Functional Leaders Visualize Key Metrics
Create live, collaborative financial dashboards to track comparative branch performance, average balance size, number of transactions per period, and loans outstanding by officer. Provide executives with consolidated financial analytics to identify areas for focused collections activity and reduced expense costs. Easily automate the distribution of branch-level reports for managers at each branch.
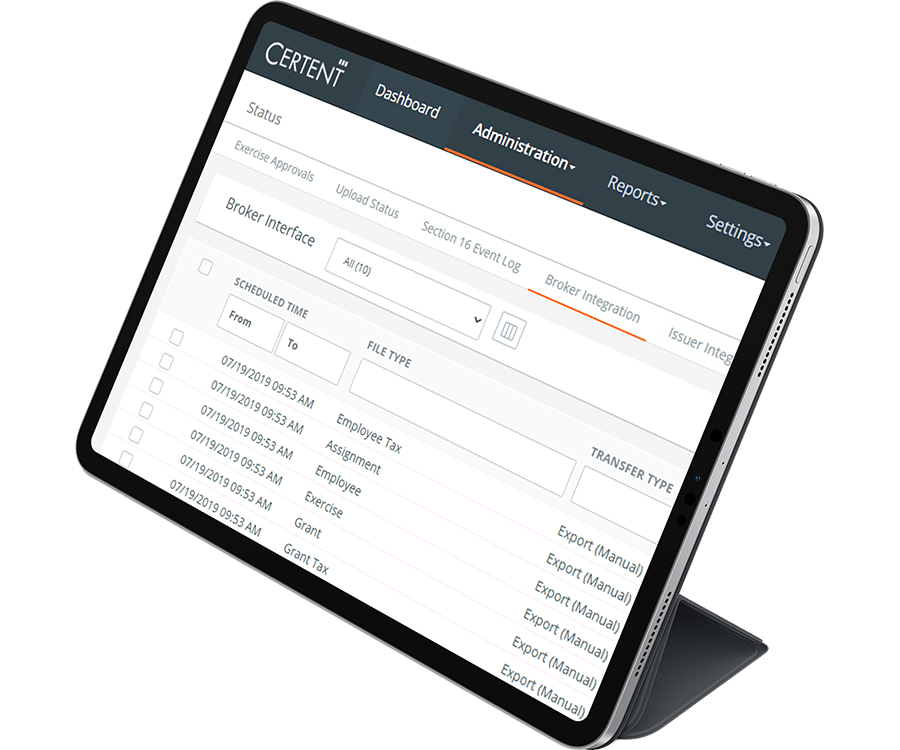
Simplify Equity Compensation Management and Reduce Risk
Simplify equity compensation administration from managing plans through to streaming ASC 718 compliance and reporting. Handle multiple types of equity compensation from stock options to performance share awards. Save time by automating the process from setting up your plans to producing accurate figures for internal and external reporting. Minimize time spent handling inquiries by providing a participant portal to enable employees to review their awards, accept the terms, and keep track of their plan’s performance.
COREP/FINREP: Eliminate Manual Workflows, Improve Collaboration, End Finger-Pointing
Transform the recurring COREP (Common Reporting) and FINREP (Financial Reporting) reporting headache into a consistent, repeatable, and controlled process with built-in compliance. Pre-built reporting templates simplify report generation for credit institutions and investment firms operating in the European Economic Area (EEA). Purpose-built filing packages provide all templates and XBRL connectivity necessary for compliance with the European Banking Authority (EBA) – including national variations – all within a familiar Microsoft Office environment.
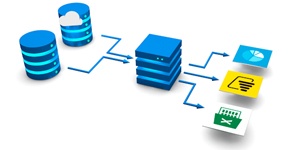
Integrates with:

- Oracle E-Business Suite (EBS)
- Oracle EPM Cloud
- Oracle ERP Cloud
- Oracle Essbase
- Oracle Financial Consolidation and Close (FCCS)
- Oracle Fusion
- Oracle Hyperion Enterprise
- Oracle Hyperion Financial Management (HFM)
- Oracle Hyperion Planning
- Oracle PeopleSoft
- Oracle Planning and Budgeting Cloud Service (PBCS)
- Oracle Tax Reporting


- Dynamics 365 Business Central
- Dynamics 365 Finance and Supply Chain Management
- Dynamics AX
- Dynamics CRM
- Dynamics GP
- Dynamics NAV
- Dynamics NAV C5
- Dynamics SL
- SQL Server Analysis Services (SSAS)


- Deltek Ajera
- Deltek Maconomy
- Deltek VantagePoint
- Deltek Vision
- Deltek Vision Cloud

- Viewpoint Spectrum
- Viewpoint Vista

- MRI Commercial Management
- MRI Financials
- MRI Horizon
- MRI Horizon CRE
- MRI Qube Horizon
- MRI Residential Management
- Epicor Avante
- Epicor BisTrack
- Epicor CMS
- Epicor Enterprise
- Epicor Epicor SLS
- Epicor iScala
- Epicor Kinetic
- Epicor LumberTrack
- Epicor Manage 2000
- Epicor Prophet 21
- Epicor Tropos

- Infor CloudSuite Financials
- Infor Distribution SX.e
- Infor Financials & Supply Management
- Infor Lawson
- Infor M3
- Infor System21
- Infor SyteLine
- Sage 100
- Sage 100 Contractor
- Sage 200
- Sage 300
- Sage 300 CRE (Timberline)
- Sage 500
- Sage 50cloud Accounting
- Sage AccPac
- Sage Adonix Tolas
- Sage Estimating
- Sage Intacct
- Sage MAS
- Sage X3
- 24SevenOffice
- A+
- AARO
- AccountEdge
- Accounting CS
- Accountmate
- Acumatica
- Alere
- Anaplan
- Aptean
- Assist
- ASW
- Aurora (Sys21)
- Axion
- Axis
- BAAN
- Banner
- Blackbaud
- BlueLink
- Book Works
- BPCS
- Cayenta
- CCH
- CDK Global
- CedAr e-financials
- CGI Advantage
- Clarus
- CMiC
- CMS (Solarsoft)
- Coda
- Coins
- Colleague
- CPSI
- CSC CorpTax
- Custom
- CYMA
- DAC
- Data Warehouse
- Datatel
- DATEV
- Davisware Global Edge
- Davisware S2K
- Deacom
- DPN
- e5
- eCMS
- Eden (Tyler Tech)
- Emphasys
- Entrata
- Etail
- Expandable
- FAMIS
- Famous Software
- Fern
- FinancialForce
- FireStream
- FIS
- FiServ
- Flexi
- Fortnox
- Foundation
- Fourth Shift
- Friedman
- Full Circle
- GEMS
- Harris Data (AS/400)
- HCS
- HMS
- IBM Cognos TM1
- IBS
- IBS-DW
- In-House Developed
- Incode
- INFINIUM
- IQMS
- iSuite
- Jack Henry
- Jenzabar
- JobBOSS
- Jonas Construction
- M1
- Macola
- MACPAC
- Made2Manage
- MAM
- MAM Autopart
- Manman
- Mapics
- McLeod
- MEDITECH
- MFG Pro
- MicrosOpera
- MIP
- Mitchell Humphrey
- Movex
- MRI
- MSGovern
- Munis (Tyler Tech)
- New World Systems
- Onesite
- Onestream XF
- Open Systems
- PDI
- Penta
- Plexxis
- PowerOffice
- PRMS
- Pro Contractor
- ProLaw
- Q360
- QAD
- Quantum
- Qube Horizon
- QuickBooks Desktop Premier
- QuickBooks Desktop Pro
- Quickbooks Enterprise
- QuickBooks Online
- Quorum
- RealPage
- REST API
- Retalix
- Ross
- SmartStream
- Spokane
- Springbrook
- Standalone DB with ODBC/DSN connection
- Standalone IBM DB
- Standalone Oracle DB
- Standalone SQL DB
- SUN
- Sunguard
- SunSystems
- Sys21
- SyteLine
- TAM (Applied Systems)
- Thomson Reuters Tax
- Timberline
- TIMELINE
- Traverse
- TripleTex
- Unit4
- Unit4 Agresso
- Unit4 Business World
- Unit4 Coda
- USL Financials
- Vadim
- VAI-System 2000
- Vantage
- Vertex
- Visma
- Winshuttle
- Wolters Kluwer CCH Tagetik
- WorkDay
- Xero
- xLedger
- Xperia
- Yardi
- Yardi-SaaS
Simplify and Speed Up Financial Report Creation
Whether you’re a spreadsheet expert or new to the business report world, download our Top 10 Best Practices for Financial Reporting in Excel guide to help streamline your report creation process.
Learn How to:
- Make reports more interactive
- Increase report usability
- Tailor reports for your audience
- Prevent unwanted spreadsheet errors
“The biggest tangible benefit has been the time saved in reporting monthly financials in SAP, and how Wands has dramatically reduced closing time.”
Speak to an Expert
Related Resources

2023 Finance Team Trends Report