Accelerate Financial Processes to Proactively Manage Healthcare Provider Costs
How Easily Can You Access Financial and Operational Data to Tackle the Increasing Complexity of Healthcare Reporting?
Difficulty Accessing the Right Data to Facilitate a Quick Response
Your team is tasked with supporting ad hoc inquiries and claims management, but they struggle to locate the data they need. With complex reporting needs, too often you’re left with no choice but to submit requests to IT and wait for them to build or update your reports.
Existing Tools Are Not Optimized for Reporting
Native ERP reporting tools cover the basics, but when you want to tackle more complex reporting needs, they tend to be slow and inflexible, requiring IT help and expertise, and often resulting in time-consuming data dumps to Excel. This makes it hard to efficiently manage the financial close process across multiple healthcare facilities and retain the ability to consolidate in multiple ways—on time, with flexibility for last minute changes.

Changes in Billing Processes and HIPAA Requirements
Healthcare finance teams need to be swift and flexible to respond to changes in billing regulations, while ensuring HIPAA compliance, managing cash flow, and tracking profitability. Extracting the data needed from ERPs to support these needs is painstakingly slow and still requires hours of manipulation in Excel before reports can be disseminated—which means data is often stale before it reaches decision makers.
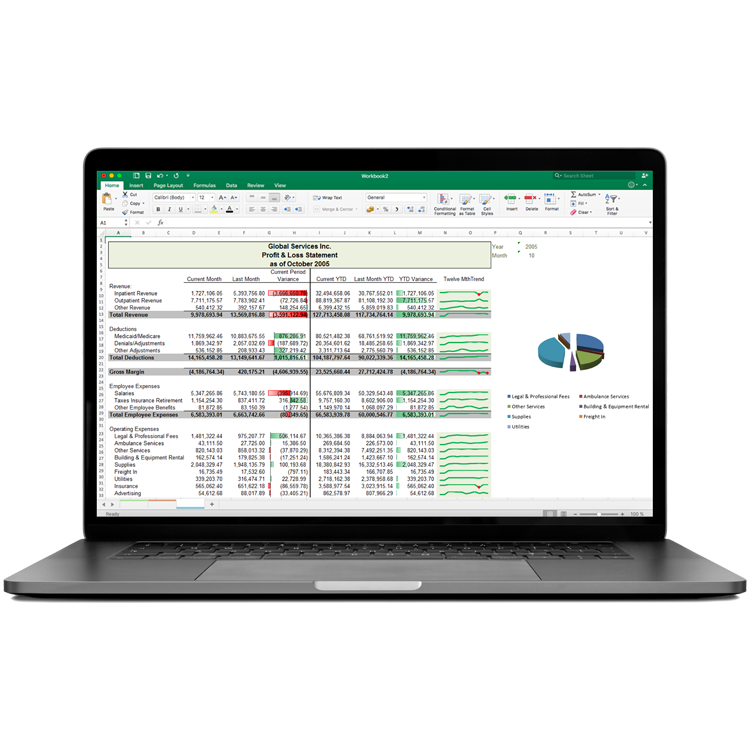
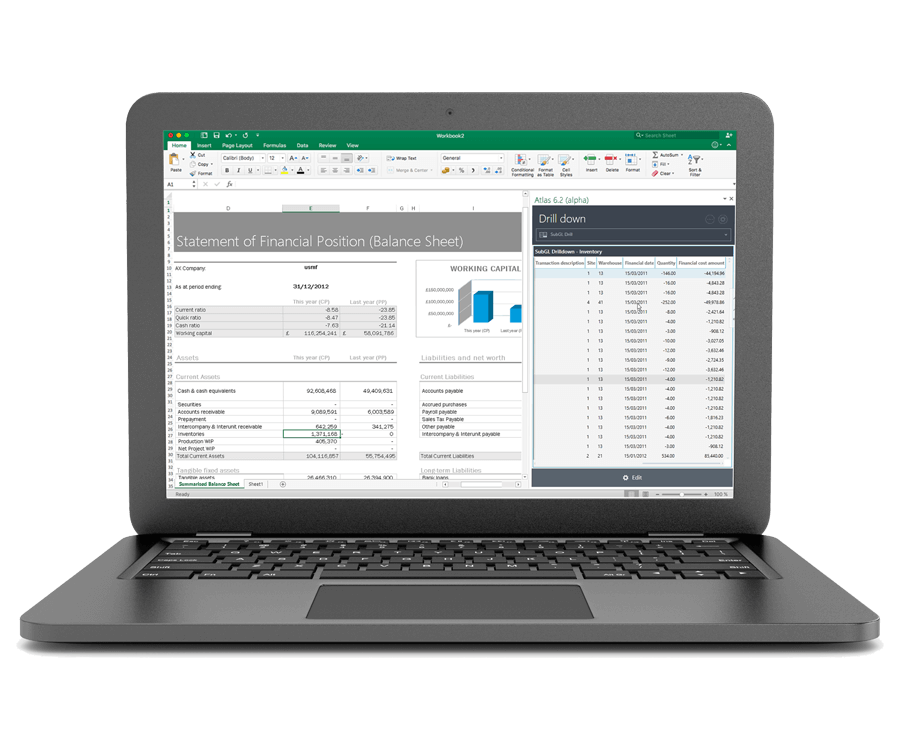
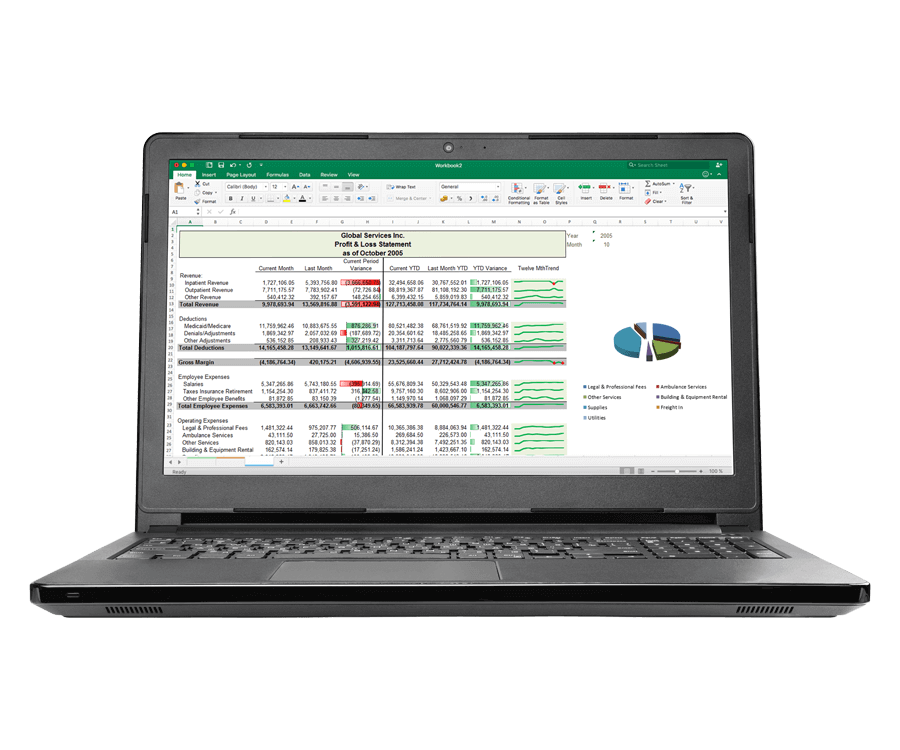
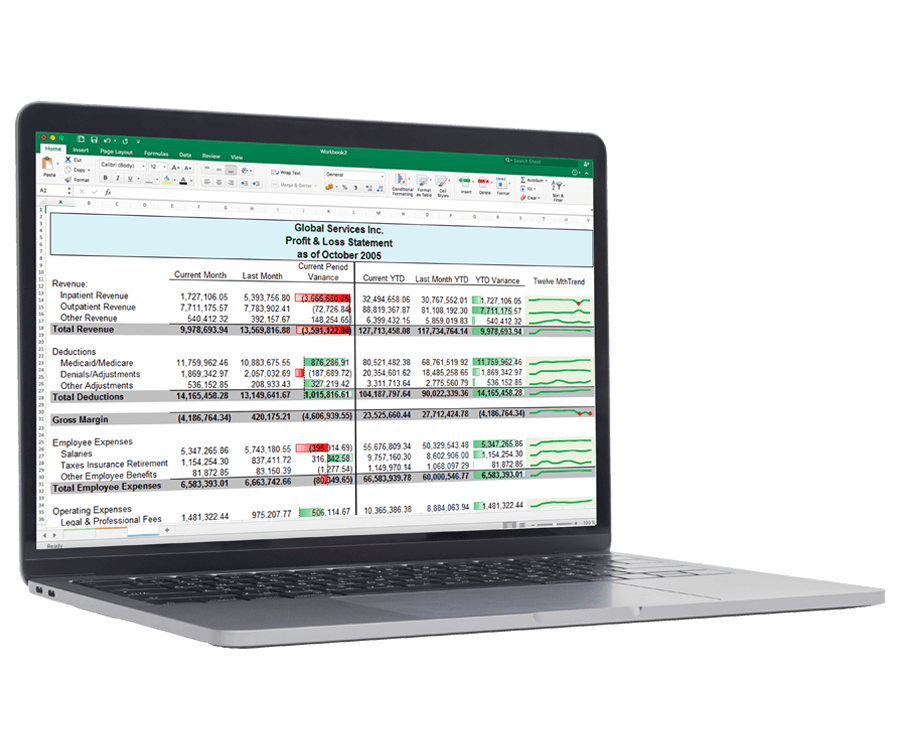
Create Real-Time, Drillable Healthcare Reports in Excel
Empower your finance team to build refreshable reports, optimized to provide them with the insights they need when they need them. With direct access to real-time data, users can drill down to rejection codes for first pass analysis, or access data needed to conduct comparisons with peer healthcare institutions without spending hours formatting in Excel.
Provide Self-Service Access to Critical Healthcare Data
Whether you are using Sage, Lawson, Oracle EBS, Microsoft Dynamics, SAP, or any number of healthcare management systems, you can manage multiple entities in the General Ledger—without manual data pulls or reliance on IT. Self-service access to your organization’s data means users can easily access everything from budgeting to daily reporting across patients, facilities, insurance, and networks.
Increase Flexibility and Comply with Changing Regulations
Stay agile by using a reporting tool that allows for easy adjustments so you can comply with healthcare regulations as they change. Reporting directly over your ERP system provides a single source of truth for internal and external financial reporting to ensure consistent decision-making, while integrating controls on PII to comply with federal regulations.
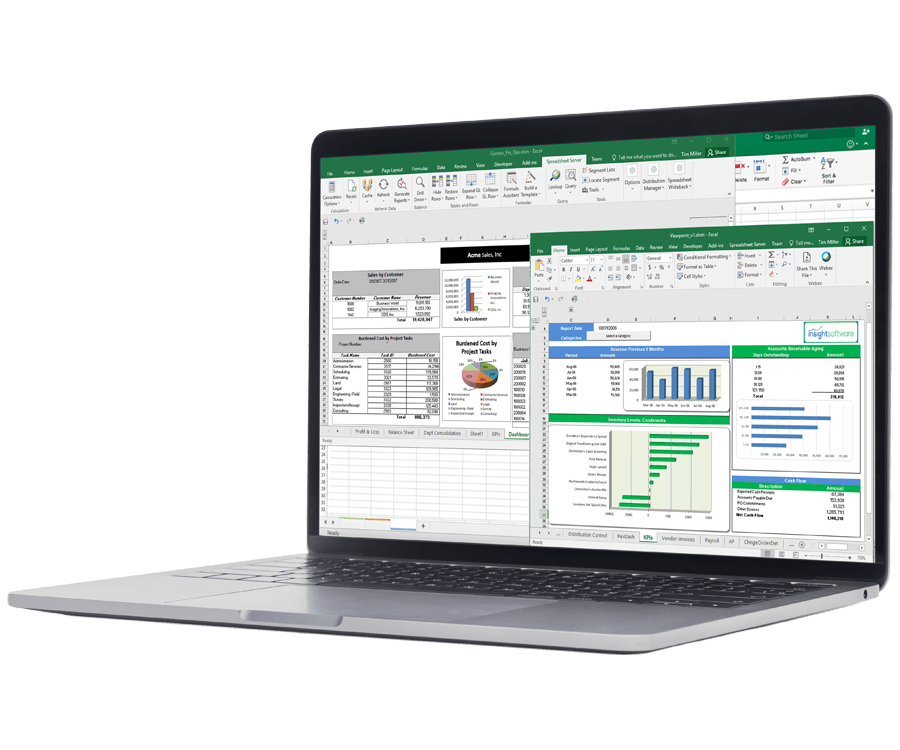
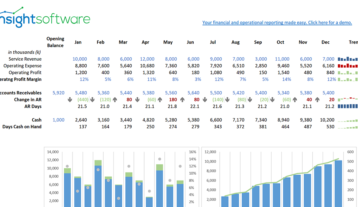
Improve Patient Care and Help Executives Visualize Key Metrics
Create dashboards to track critical trends like patient visitation and profitability by department or provider, and provide insights into unaddressed areas of opportunity. Easily pull in data from other business systems or databases. Provide executives and functional leaders with the key data they need in a visual format they can easily digest.
Integrates with:
- Oracle E-Business Suite (EBS)
- Oracle EPM Cloud
- Oracle ERP Cloud
- Oracle Essbase
- Oracle Financial Consolidation and Close (FCCS)
- Oracle Fusion
- Oracle Hyperion Enterprise
- Oracle Hyperion Financial Management (HFM)
- Oracle Hyperion Planning
- Oracle PeopleSoft
- Oracle Planning and Budgeting Cloud Service (PBCS)
- Oracle Tax Reporting

- Dynamics 365 Business Central
- Dynamics 365 Finance and Supply Chain Management
- Dynamics AX
- Dynamics CRM
- Dynamics GP
- Dynamics NAV
- Dynamics NAV C5
- Dynamics SL
- SQL Server Analysis Services (SSAS)

- Deltek Ajera
- Deltek Maconomy
- Deltek VantagePoint
- Deltek Vision
- Deltek Vision Cloud

- Viewpoint Spectrum
- Viewpoint Vista
- MRI Commercial Management
- MRI Financials
- MRI Horizon
- MRI Horizon CRE
- MRI Qube Horizon
- MRI Residential Management
- Epicor Avante
- Epicor BisTrack
- Epicor CMS
- Epicor Enterprise
- Epicor Epicor SLS
- Epicor iScala
- Epicor Kinetic
- Epicor LumberTrack
- Epicor Manage 2000
- Epicor Prophet 21
- Epicor Tropos
- Infor CloudSuite Financials
- Infor Distribution SX.e
- Infor Financials & Supply Management
- Infor Lawson
- Infor M3
- Infor System21
- Infor SyteLine
- Sage 100
- Sage 100 Contractor
- Sage 200
- Sage 300
- Sage 300 CRE (Timberline)
- Sage 500
- Sage 50cloud Accounting
- Sage AccPac
- Sage Adonix Tolas
- Sage Estimating
- Sage Intacct
- Sage MAS
- Sage X3
- 24SevenOffice
- A+
- AARO
- AccountEdge
- Accounting CS
- Accountmate
- Acumatica
- Alere
- Anaplan
- Aptean
- Assist
- ASW
- Aurora (Sys21)
- Axion
- Axis
- BAAN
- Banner
- Blackbaud
- BlueLink
- Book Works
- BPCS
- Cayenta
- CCH
- CDK Global
- CedAr e-financials
- CGI Advantage
- Clarus
- CMiC
- CMS (Solarsoft)
- Coda
- Coins
- Colleague
- CPSI
- CSC CorpTax
- Custom
- CYMA
- DAC
- Data Warehouse
- Datatel
- DATEV
- Davisware Global Edge
- Davisware S2K
- Deacom
- DPN
- e5
- eCMS
- Eden (Tyler Tech)
- Emphasys
- Entrata
- Etail
- Expandable
- FAMIS
- Famous Software
- Fern
- FinancialForce
- FireStream
- FIS
- FiServ
- Flexi
- Fortnox
- Foundation
- Fourth Shift
- Friedman
- Full Circle
- GEMS
- Harris Data (AS/400)
- HCS
- HMS
- IBM Cognos TM1
- IBS
- IBS-DW
- In-House Developed
- Incode
- INFINIUM
- IQMS
- iSuite
- Jack Henry
- Jenzabar
- JobBOSS
- Jonas Construction
- M1
- Macola
- MACPAC
- Made2Manage
- MAM
- MAM Autopart
- Manman
- Mapics
- McLeod
- MEDITECH
- MFG Pro
- MicrosOpera
- MIP
- Mitchell Humphrey
- Movex
- MRI
- MSGovern
- Munis (Tyler Tech)
- New World Systems
- Onesite
- Onestream XF
- Open Systems
- PDI
- Penta
- Plexxis
- PowerOffice
- PRMS
- Pro Contractor
- ProLaw
- Q360
- QAD
- Quantum
- Qube Horizon
- QuickBooks Desktop Premier
- QuickBooks Desktop Pro
- Quickbooks Enterprise
- QuickBooks Online
- Quorum
- RealPage
- REST API
- Retalix
- Ross
- SmartStream
- Spokane
- Springbrook
- Standalone DB with ODBC/DSN connection
- Standalone IBM DB
- Standalone Oracle DB
- Standalone SQL DB
- SUN
- Sunguard
- SunSystems
- Sys21
- SyteLine
- TAM (Applied Systems)
- Thomson Reuters Tax
- Timberline
- TIMELINE
- Traverse
- TripleTex
- Unit4
- Unit4 Agresso
- Unit4 Business World
- Unit4 Coda
- USL Financials
- Vadim
- VAI-System 2000
- Vantage
- Vertex
- Visma
- Winshuttle
- Wolters Kluwer CCH Tagetik
- WorkDay
- Xero
- xLedger
- Xperia
- Yardi
- Yardi-SaaS
Simplify and Speed Up Financial Report Creation
Whether you’re a spreadsheet expert or new to the business report world, download our Top 10 Best Practices for Healthcare Reporting in Excel guide to help streamline your report creation process.
Learn How to:
- Make reports more interactive
- Increase report usability
- Tailor reports for your audience
- Prevent unwanted spreadsheet errors
“By using Spreadsheet Server we have decreased the amount of time to compile our monthly financial statements and freed up those resources to do more analytical work.”
Speak to an Expert
Related Resources