Control Costs and Simplify Compliance Management with Insightful Pharmaceutical Reporting
Improve Efficiency with Real-Time Data Access and Automated Financial Reporting

Manual Reporting is Time-Consuming and Error Prone
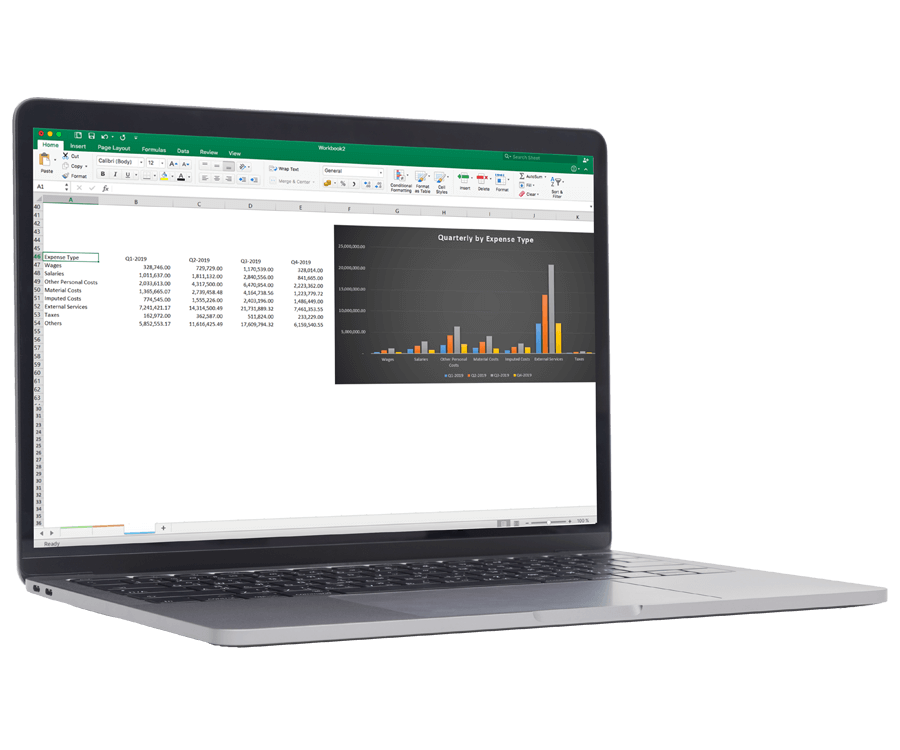
Your finance team should play a key role in the strategy surrounding the product development lifecycle. Everything from the ability to flexibly integrate acquisitions and divestitures to discerning trends in inventory costs falls under the umbrella of the finance team’s responsibilities. However, much of their time is taken up by manual reporting processes. Resorting to dumping data into Excel and manually formatting and manipulating not only takes time, it also exposes you to the risk of manual errors and inaccuracies.

Existing Tools Are Not Optimized for Financial Reporting
You need to support increased demand by providing insights into where costs and investments can address growth, but native ERP reporting tools lack the flexibility needed to accomplish this efficiently across multiple data sources. Without real-time access to a single version of the truth, your ability to support critical decisions like cash flow management or manufacturing capacity is severely hampered.

Regulatory Standards Require Consistent, Accurate Reporting
To comply with ever changing and expanding regulations, there is an urgent need for pharmaceutical organizations to integrate governance, risk, and compliance on a global level. You need a controlled environment with accountability in order to streamline reporting and reduce the risk of inaccurate statements. Data accuracy is key, and often suffers due to lack of suitable reporting tools.
Automate Reporting and Stay Ahead of the Curve
Empower your finance team to build refreshable, automated reports across any ERP module to provide the insights they need when they need them. Without manual data pulls or reliance on IT, you can efficiently manage costs from procurement to commercialization and quickly meet customized requests, such as cash flow projections based on inventory and order status.
Create Standardized Reporting and Simplify Day-to-Day Tracking
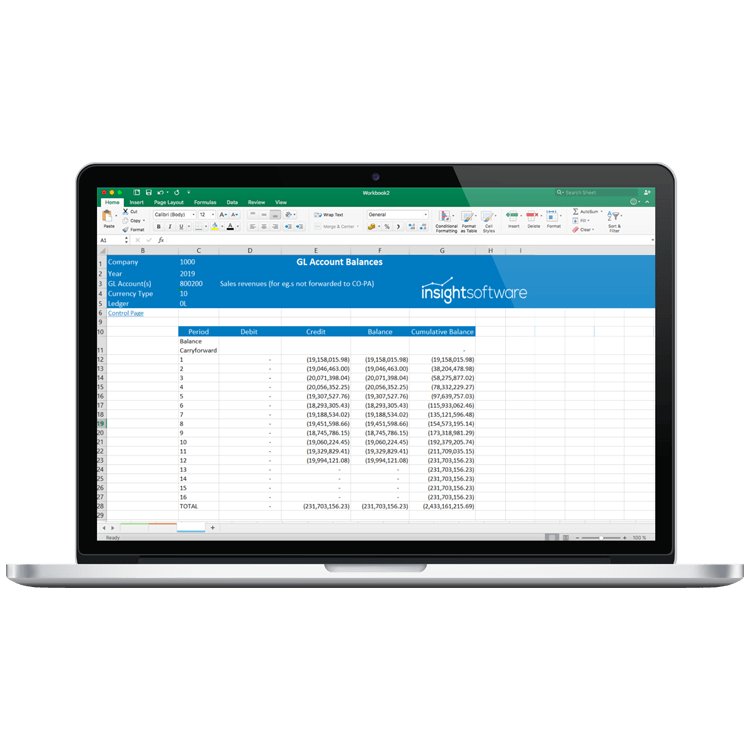
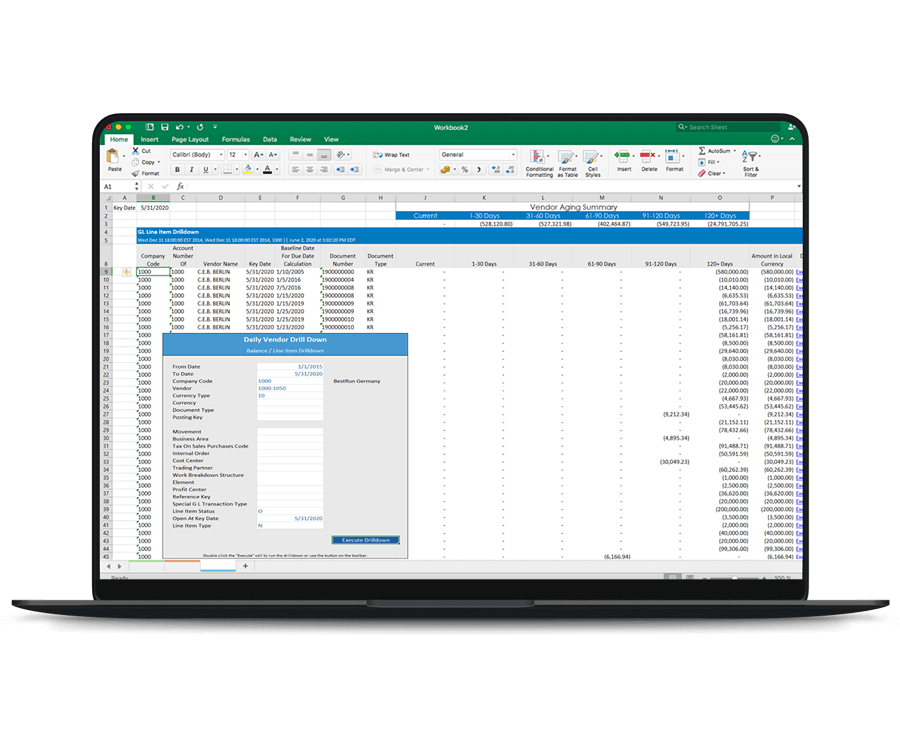
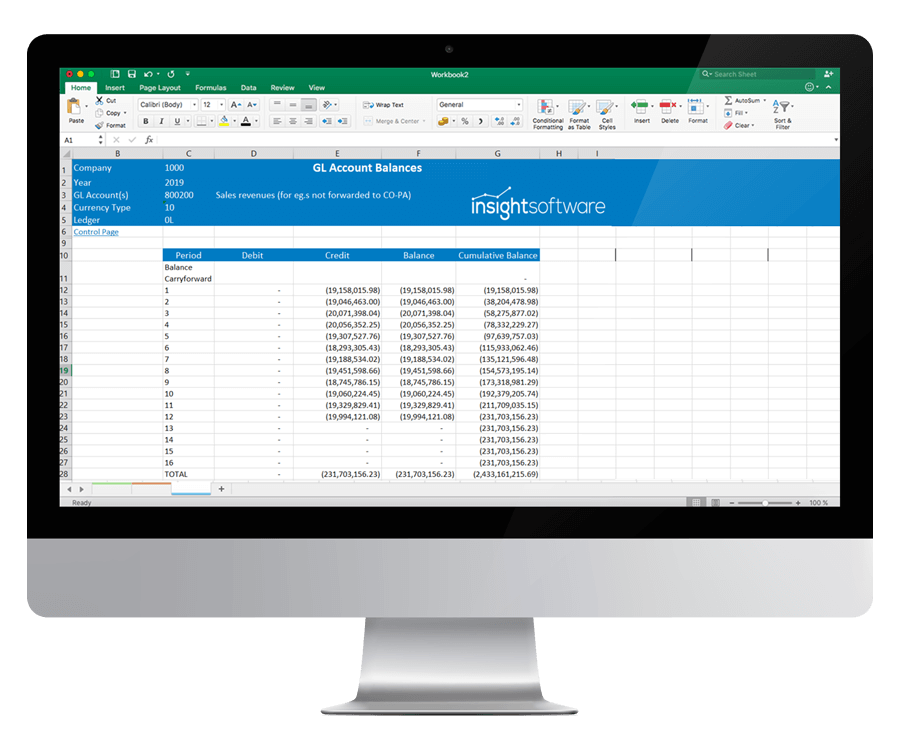
Whether you are using Oracle EBS, Microsoft Dynamics, SAP, JD Edwards, or another ERP, streamline report creation with a solution that pulls directly from multiple data sources. With ERPsmarts that use a direct, real-time connection to understand your data, you can drill into journals, balances, sub-ledgers, and transactions to find and quickly fix reconciliation or data integrity issues and get fast answers to critical questions.
Maintain Compliance While Increasing Flexibility
Stay agile by using a reporting tool that allows for easy configuration so you can comply with regulatory requirements as they change. Create self-service reports to meet federal and industry regulatory establishment requirements, streamline DEA reporting, and maintain key transactional history for audit reports. Reporting directly over your ERP system provides a single source of truth for internal and external financial reporting.
Visualize Key Metrics and Enable Accurate Forecasting
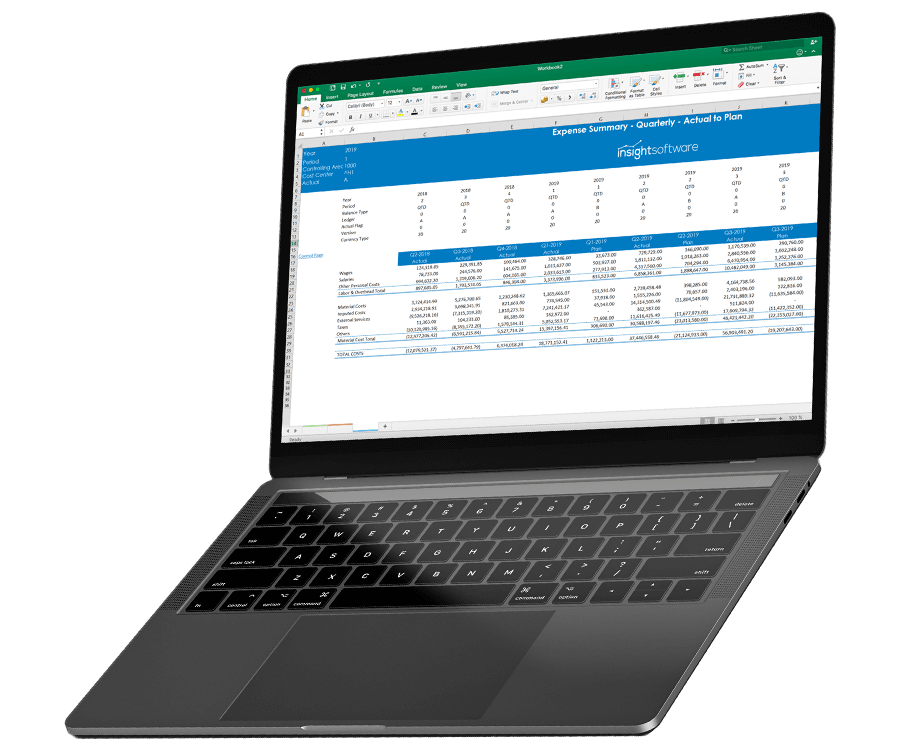
Create charts, graphs, and other visuals to easily analyze profitability and strategic alliances. Pull in data from other business systems or databases seamlessly to enable accurate forecasting and predict future procurement costs. Simplify the budget and planning process by providing decision makers with the key data they need in a visual format they can easily digest.
Integrates with:
- Oracle E-Business Suite (EBS)
- Oracle EPM Cloud
- Oracle ERP Cloud
- Oracle Essbase
- Oracle Financial Consolidation and Close (FCCS)
- Oracle Fusion
- Oracle Hyperion Enterprise
- Oracle Hyperion Financial Management (HFM)
- Oracle Hyperion Planning
- Oracle PeopleSoft
- Oracle Planning and Budgeting Cloud Service (PBCS)
- Oracle Tax Reporting

- Dynamics 365 Business Central
- Dynamics 365 Finance and Supply Chain Management
- Dynamics AX
- Dynamics CRM
- Dynamics GP
- Dynamics NAV
- Dynamics NAV C5
- Dynamics SL
- SQL Server Analysis Services (SSAS)


- Deltek Ajera
- Deltek Maconomy
- Deltek VantagePoint
- Deltek Vision
- Deltek Vision Cloud

- Viewpoint Spectrum
- Viewpoint Vista

- MRI Commercial Management
- MRI Financials
- MRI Horizon
- MRI Horizon CRE
- MRI Qube Horizon
- MRI Residential Management
- Epicor Avante
- Epicor BisTrack
- Epicor CMS
- Epicor Enterprise
- Epicor Epicor SLS
- Epicor iScala
- Epicor Kinetic
- Epicor LumberTrack
- Epicor Manage 2000
- Epicor Prophet 21
- Epicor Tropos

- Infor CloudSuite Financials
- Infor Distribution SX.e
- Infor Financials & Supply Management
- Infor Lawson
- Infor M3
- Infor System21
- Infor SyteLine
- Sage 100
- Sage 100 Contractor
- Sage 200
- Sage 300
- Sage 300 CRE (Timberline)
- Sage 500
- Sage 50cloud Accounting
- Sage AccPac
- Sage Adonix Tolas
- Sage Estimating
- Sage Intacct
- Sage MAS
- Sage X3
- 24SevenOffice
- A+
- AARO
- AccountEdge
- Accounting CS
- Accountmate
- Acumatica
- Alere
- Anaplan
- Aptean
- Assist
- ASW
- Aurora (Sys21)
- Axion
- Axis
- BAAN
- Banner
- Blackbaud
- BlueLink
- Book Works
- BPCS
- Cayenta
- CCH
- CDK Global
- CedAr e-financials
- CGI Advantage
- Clarus
- CMiC
- CMS (Solarsoft)
- Coda
- Coins
- Colleague
- CPSI
- CSC CorpTax
- Custom
- CYMA
- DAC
- Data Warehouse
- Datatel
- DATEV
- Davisware Global Edge
- Davisware S2K
- Deacom
- DPN
- e5
- eCMS
- Eden (Tyler Tech)
- Emphasys
- Entrata
- Etail
- Expandable
- FAMIS
- Famous Software
- Fern
- FinancialForce
- FireStream
- FIS
- FiServ
- Flexi
- Fortnox
- Foundation
- Fourth Shift
- Friedman
- Full Circle
- GEMS
- Harris Data (AS/400)
- HCS
- HMS
- IBM Cognos TM1
- IBS
- IBS-DW
- In-House Developed
- Incode
- INFINIUM
- IQMS
- iSuite
- Jack Henry
- Jenzabar
- JobBOSS
- Jonas Construction
- M1
- Macola
- MACPAC
- Made2Manage
- MAM
- MAM Autopart
- Manman
- Mapics
- McLeod
- MEDITECH
- MFG Pro
- MicrosOpera
- MIP
- Mitchell Humphrey
- Movex
- MRI
- MSGovern
- Munis (Tyler Tech)
- New World Systems
- Onesite
- Onestream XF
- Open Systems
- PDI
- Penta
- Plexxis
- PowerOffice
- PRMS
- Pro Contractor
- ProLaw
- Q360
- QAD
- Quantum
- Qube Horizon
- QuickBooks Desktop Premier
- QuickBooks Desktop Pro
- Quickbooks Enterprise
- QuickBooks Online
- Quorum
- RealPage
- REST API
- Retalix
- Ross
- SmartStream
- Spokane
- Springbrook
- Standalone DB with ODBC/DSN connection
- Standalone IBM DB
- Standalone Oracle DB
- Standalone SQL DB
- SUN
- Sunguard
- SunSystems
- Sys21
- SyteLine
- TAM (Applied Systems)
- Thomson Reuters Tax
- Timberline
- TIMELINE
- Traverse
- TripleTex
- Unit4
- Unit4 Agresso
- Unit4 Business World
- Unit4 Coda
- USL Financials
- Vadim
- VAI-System 2000
- Vantage
- Vertex
- Visma
- Winshuttle
- Wolters Kluwer CCH Tagetik
- WorkDay
- Xero
- xLedger
- Xperia
- Yardi
- Yardi-SaaS
Simplify and Speed Up Financial Report Creation
Whether you’re a spreadsheet expert or new to the business report world, download our Top 10 Best Practices for Pharmaceutical Reporting in Excel guide to help streamline your report creation process.
Learn How to:
- Make reports more interactive
- Increase report usability
- Tailor reports for your audience
- Prevent unwanted spreadsheet errors
Work with the #1 Pharma Reporting, Analytics & Dashboard Software Vendor

"Workflow approval processes improved with the ability to identify departmental bottlenecks using a workflow analysis.”

Speak to an Expert