How Easily Can You Access Financial Data to Tackle the Increasing Complexity of Government Reporting?

No Single Source for Data and Limited Access Increases Delays
Your agency is often required to use multiple systems that lack integration to one another. This lack of integration, often compounded by restricted access to relevant data, results in overly manual processes and reliance on the IT department—something for which your already stretched finance team doesn’t have time.

Existing Tools Are Not Optimized for Government Reporting
Available reporting tools within your systems require time for manual queries and data dumps to Excel, along with a team that has deep knowledge of the data sets. Additional software that consolidates data sources and enhances reporting often comes with a steep learning curve, requiring finance professionals to sacrifice even more time.

Changing Government Regulations and Shrinking Budgets
Government finance teams need to be swift and flexible in response to shifting regulations and budget tightening. Changing regulations require an ability to quickly pivot in order to meet new reporting requirements. And as departmental budgets get smaller, the need for smarter analysis only increases.
Shrink Reporting Cycles and Simplify Day-to-Day Tracking
Whether you are using Oracle EBS, Microsoft Dynamics, SAP, JD Edwards, or any number of business-critical systems, you can eliminate inefficiencies in reporting cycles by automating access to all data. Without manual data pulls or reliance on IT, you can quickly respond to increasing departmental requests for data insights while still having time to manage day-to-day responsibilities with ease.
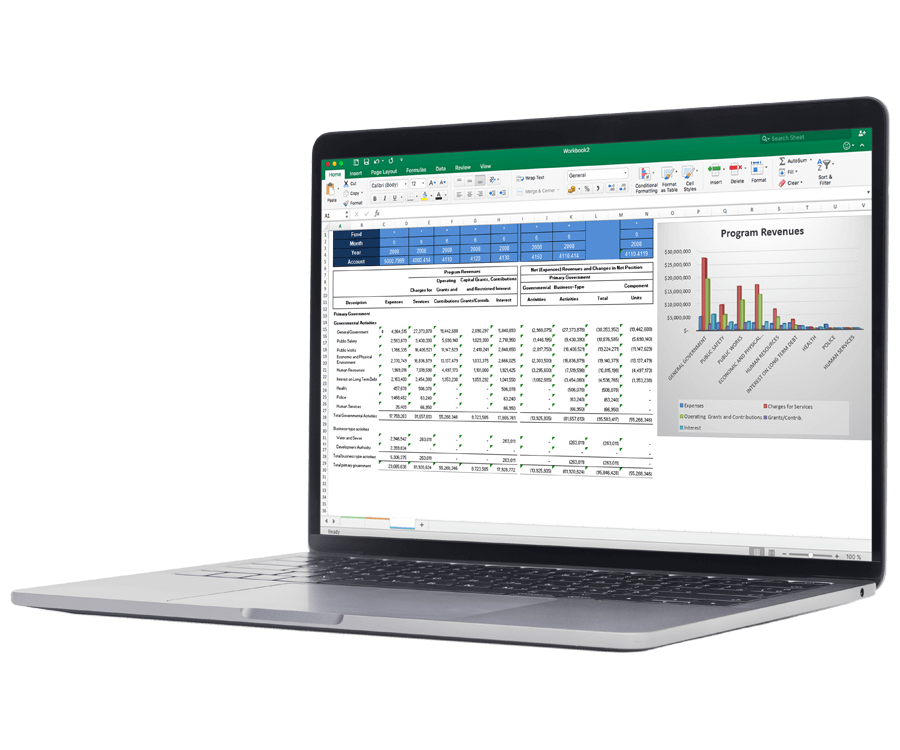
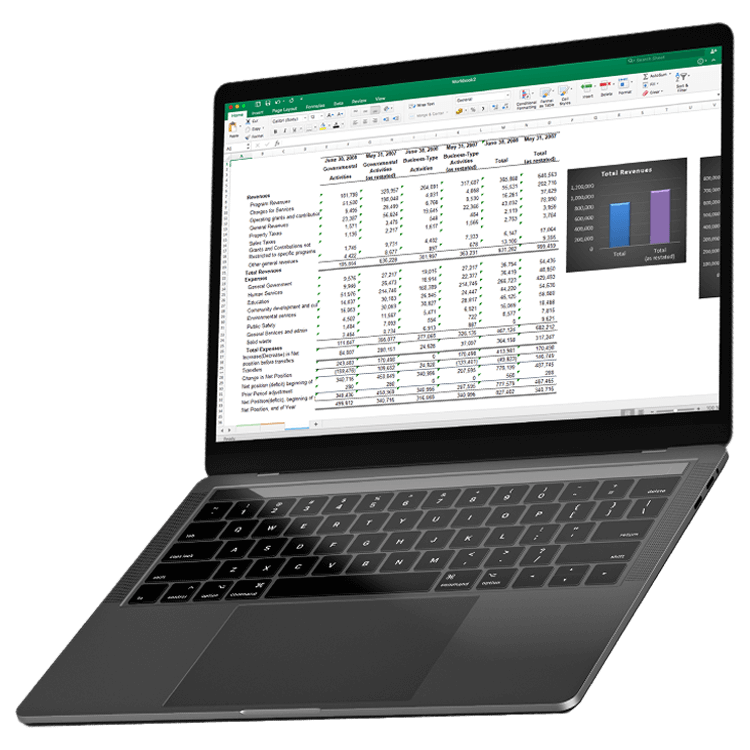
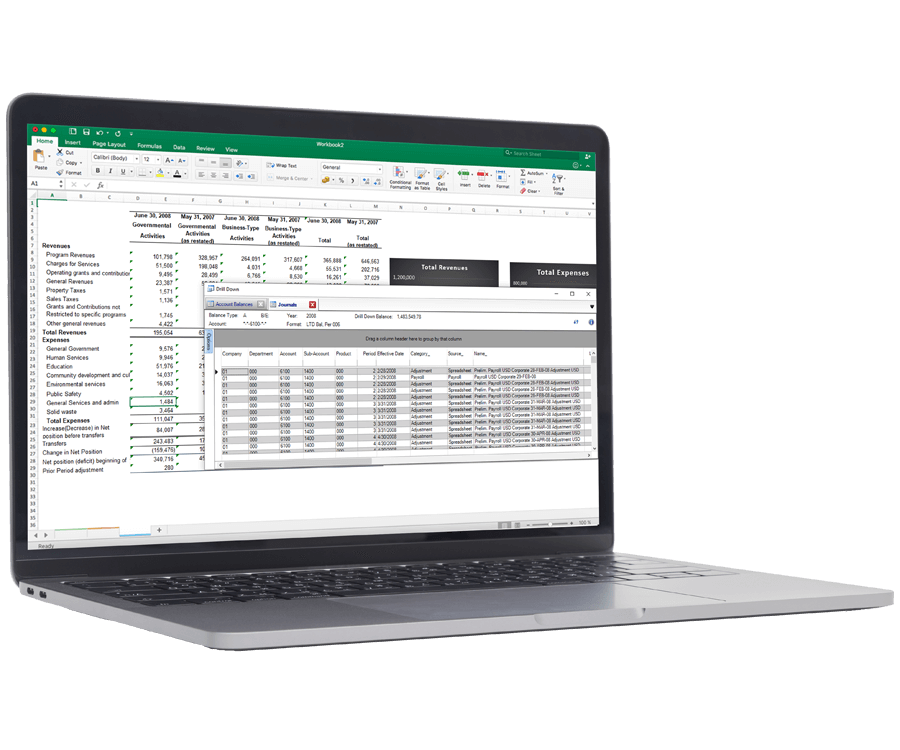
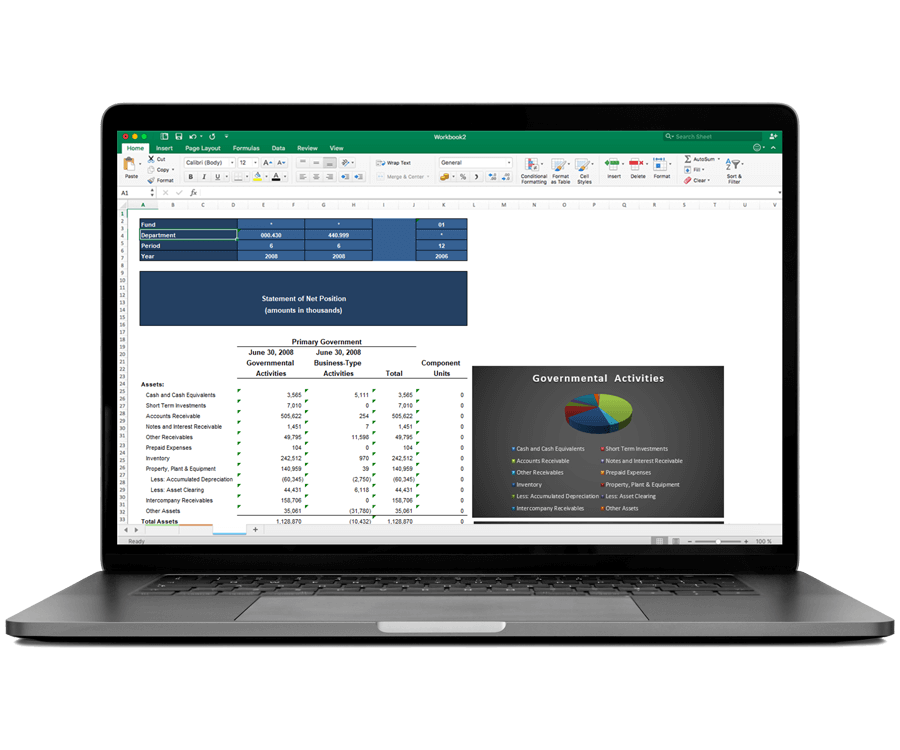
Create Real-Time, Drillable Government Reports in Excel
Empower your finance team to build refreshable reports, optimized to provide them with insights they need when they need them. With direct access to real-time data, users can drill into funds, assets, and expenses to find and quickly fix reconciliation or data integrity issues. Drill all the way down to images to quickly view checks, payments, invoices, and other documents.
Increase Flexibility and Comply with Changing Regulations
Stay agile by using a reporting tool that allows for easy adjustments so you can comply with government regulations as they change. Consolidating your data into a single, validated system of record gives you the ability create custom reports for audits, agency initiative evaluations, and budget planning directly in Excel—all without IT intervention.
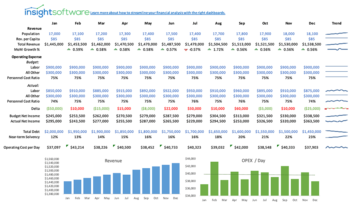
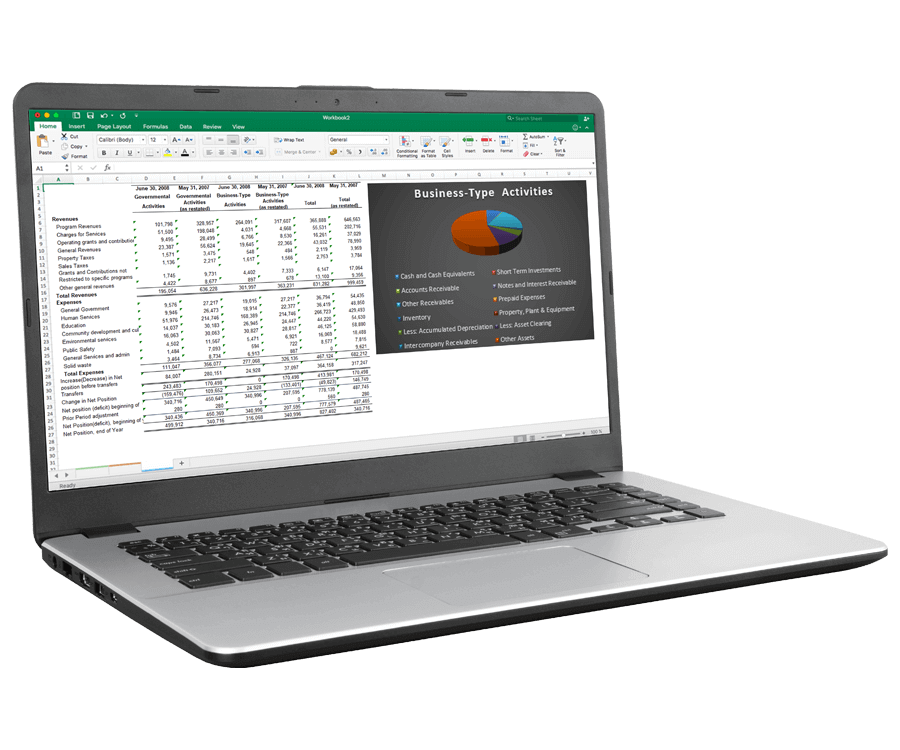
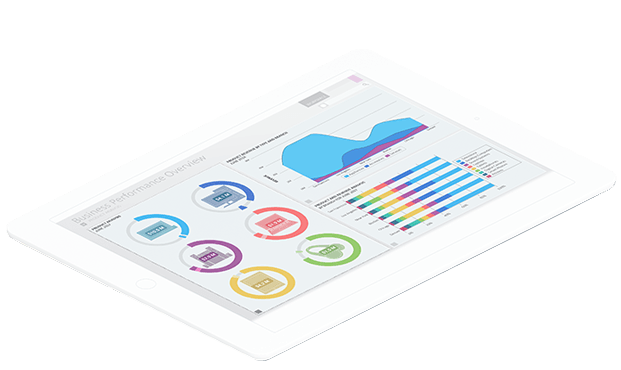
Help Constituents and Representatives Visualize Key Metrics
Create dashboards to track critical trends like debt per capita, budgeting ratios, and percentage of capital projects completed within budget. Easily pull in data from other business systems or databases. Provide citizens and public sector leaders with the key data they need in a visual format they can digest easily.
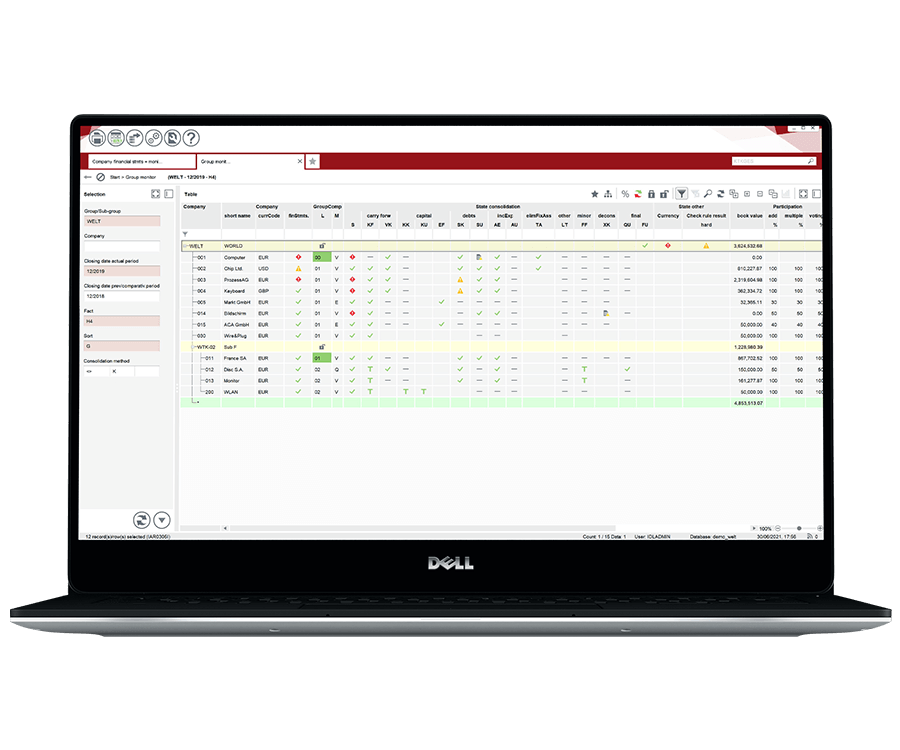
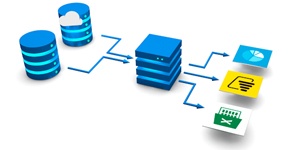
Integrate Your Budgeting, Planning, and Reporting Around a Single Source of Truth
Enable your organization to save time and effort while reducing risk. By working from a single source of truth, you can eliminate data silos, duplicated efforts, and inconsistencies between systems. Simplify compliance with built-in rules for regional and international accounting standards so you can provide auditors the transparency they need, including traceable data capabilities for all consolidation levels. With a single source of truth, you can empower your organization to work faster, more cooperatively, and with better overall efficiency.
Integrates with:

- Oracle E-Business Suite (EBS)
- Oracle EPM Cloud
- Oracle ERP Cloud
- Oracle Essbase
- Oracle Financial Consolidation and Close (FCCS)
- Oracle Fusion
- Oracle Hyperion Enterprise
- Oracle Hyperion Financial Management (HFM)
- Oracle Hyperion Planning
- Oracle PeopleSoft
- Oracle Planning and Budgeting Cloud Service (PBCS)
- Oracle Tax Reporting


- Dynamics 365 Business Central
- Dynamics 365 Finance and Supply Chain Management
- Dynamics AX
- Dynamics CRM
- Dynamics GP
- Dynamics NAV
- Dynamics NAV C5
- Dynamics SL
- SQL Server Analysis Services (SSAS)

- Deltek Ajera
- Deltek Maconomy
- Deltek VantagePoint
- Deltek Vision
- Deltek Vision Cloud

- Viewpoint Spectrum
- Viewpoint Vista

- MRI Commercial Management
- MRI Financials
- MRI Horizon
- MRI Horizon CRE
- MRI Qube Horizon
- MRI Residential Management
- Epicor Avante
- Epicor BisTrack
- Epicor CMS
- Epicor Enterprise
- Epicor Epicor SLS
- Epicor iScala
- Epicor Kinetic
- Epicor LumberTrack
- Epicor Manage 2000
- Epicor Prophet 21
- Epicor Tropos

- Infor CloudSuite Financials
- Infor Distribution SX.e
- Infor Financials & Supply Management
- Infor Lawson
- Infor M3
- Infor System21
- Infor SyteLine
- Sage 100
- Sage 100 Contractor
- Sage 200
- Sage 300
- Sage 300 CRE (Timberline)
- Sage 500
- Sage 50cloud Accounting
- Sage AccPac
- Sage Adonix Tolas
- Sage Estimating
- Sage Intacct
- Sage MAS
- Sage X3
- 24SevenOffice
- A+
- AARO
- AccountEdge
- Accounting CS
- Accountmate
- Acumatica
- Alere
- Anaplan
- Aptean
- Assist
- ASW
- Aurora (Sys21)
- Axion
- Axis
- BAAN
- Banner
- Blackbaud
- BlueLink
- Book Works
- BPCS
- Cayenta
- CCH
- CDK Global
- CedAr e-financials
- CGI Advantage
- Clarus
- CMiC
- CMS (Solarsoft)
- Coda
- Coins
- Colleague
- CPSI
- CSC CorpTax
- Custom
- CYMA
- DAC
- Data Warehouse
- Datatel
- DATEV
- Davisware Global Edge
- Davisware S2K
- Deacom
- DPN
- e5
- eCMS
- Eden (Tyler Tech)
- Emphasys
- Entrata
- Etail
- Expandable
- FAMIS
- Famous Software
- Fern
- FinancialForce
- FireStream
- FIS
- FiServ
- Flexi
- Fortnox
- Foundation
- Fourth Shift
- Friedman
- Full Circle
- GEMS
- Harris Data (AS/400)
- HCS
- HMS
- IBM Cognos TM1
- IBS
- IBS-DW
- In-House Developed
- Incode
- INFINIUM
- IQMS
- iSuite
- Jack Henry
- Jenzabar
- JobBOSS
- Jonas Construction
- M1
- Macola
- MACPAC
- Made2Manage
- MAM
- MAM Autopart
- Manman
- Mapics
- McLeod
- MEDITECH
- MFG Pro
- MicrosOpera
- MIP
- Mitchell Humphrey
- Movex
- MRI
- MSGovern
- Munis (Tyler Tech)
- New World Systems
- Onesite
- Onestream XF
- Open Systems
- PDI
- Penta
- Plexxis
- PowerOffice
- PRMS
- Pro Contractor
- ProLaw
- Q360
- QAD
- Quantum
- Qube Horizon
- QuickBooks Desktop Premier
- QuickBooks Desktop Pro
- Quickbooks Enterprise
- QuickBooks Online
- Quorum
- RealPage
- REST API
- Retalix
- Ross
- SmartStream
- Spokane
- Springbrook
- Standalone DB with ODBC/DSN connection
- Standalone IBM DB
- Standalone Oracle DB
- Standalone SQL DB
- SUN
- Sunguard
- SunSystems
- Sys21
- SyteLine
- TAM (Applied Systems)
- Thomson Reuters Tax
- Timberline
- TIMELINE
- Traverse
- TripleTex
- Unit4
- Unit4 Agresso
- Unit4 Business World
- Unit4 Coda
- USL Financials
- Vadim
- VAI-System 2000
- Vantage
- Vertex
- Visma
- Winshuttle
- Wolters Kluwer CCH Tagetik
- WorkDay
- Xero
- xLedger
- Xperia
- Yardi
- Yardi-SaaS
Simplify and Speed Up Financial Report Creation
Whether you’re a spreadsheet expert or new to the business report world, download our Top 10 Best Practices for Government Reporting in Excel guide to help streamline your report creation process.
Learn How to:
- Make reports more interactive
- Increase report usability
- Tailor reports for your audience
- Prevent unwanted spreadsheet errors
Work with the #1 Government Reporting, Analytics & Dashboard Software Vendor

“I like the simplicity of Jet Reports. I have the ability to install and run a report in five minutes.”
Speak to an Expert
Related Resources