How Easily Can You Access Financial and Operational Data to Keep Up with the Changing Demands of Retail Reporting?

Manual Retail Reporting is Time-Consuming and Error Prone
Retailers rely on data to drive growth and navigate a competitive environment. Your organization depends on finance to provide them with that essential data and analysis. However, when retail reporting is a manual process, dumping data into Excel to format and manipulate not only takes time, it also exposes you to the risk of errors and inaccuracies.

Out-of-the-Box Retail Reports Are Too Limited
You need to provide decision makers with a reliable financial outlook that spans your entire business from online to brick-and-mortar and across multiple cost centers, but native ERP reporting tools lack the flexibility needed to accomplish this efficiently across all your data sources. Without real-time access to a single version of the truth, your ability to analyze sales performance, cost efficiencies, product mix, and more in a fast-changing environment is severely hampered.

Difficulty Accessing the Right Data to Facilitate a Quick Turnaround
In addition to their day-to-day financial reporting responsibilities, your team is tasked with supporting ad hoc inquiries, but they struggle to access the data they need. With complex retail reporting needs, too often you’re left with no choice but to submit requests to IT and wait for them to build or update your reports.
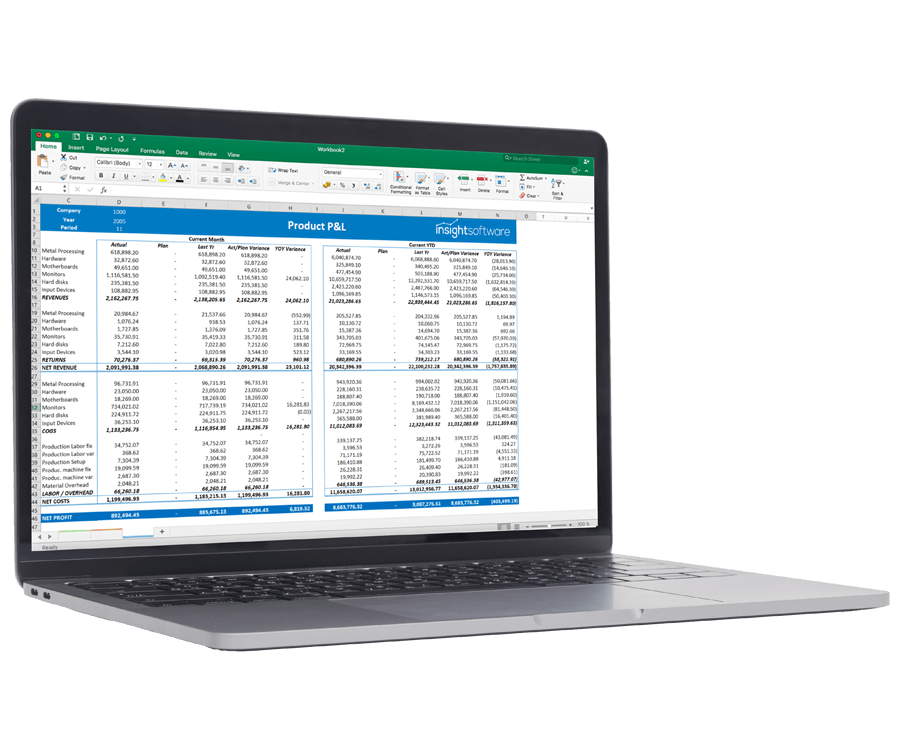
Automate Retail Reporting and Stay Ahead of the Curve
Empower your finance team to build refreshable, automated reports across any ERP module to provide the insights they need when they need them. Without manual data pulls or reliance on IT, you can efficiently manage costs from inventory to payroll and quickly meet customized requests, such as margins by distribution channel.
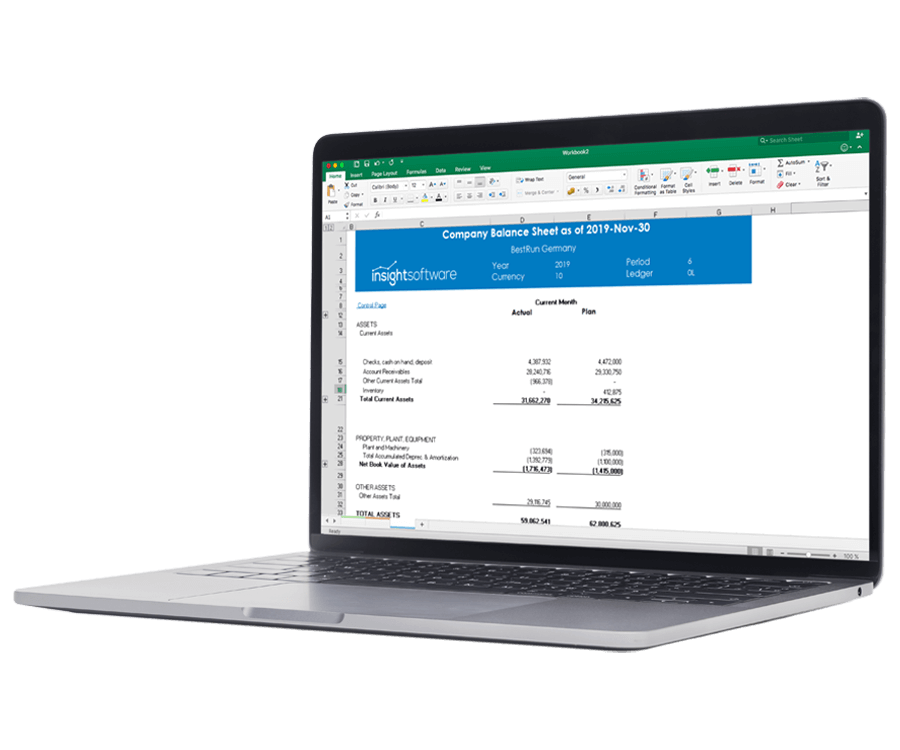
Create Standardized Reporting for Retail and Simplify Day-to-Day Tracking
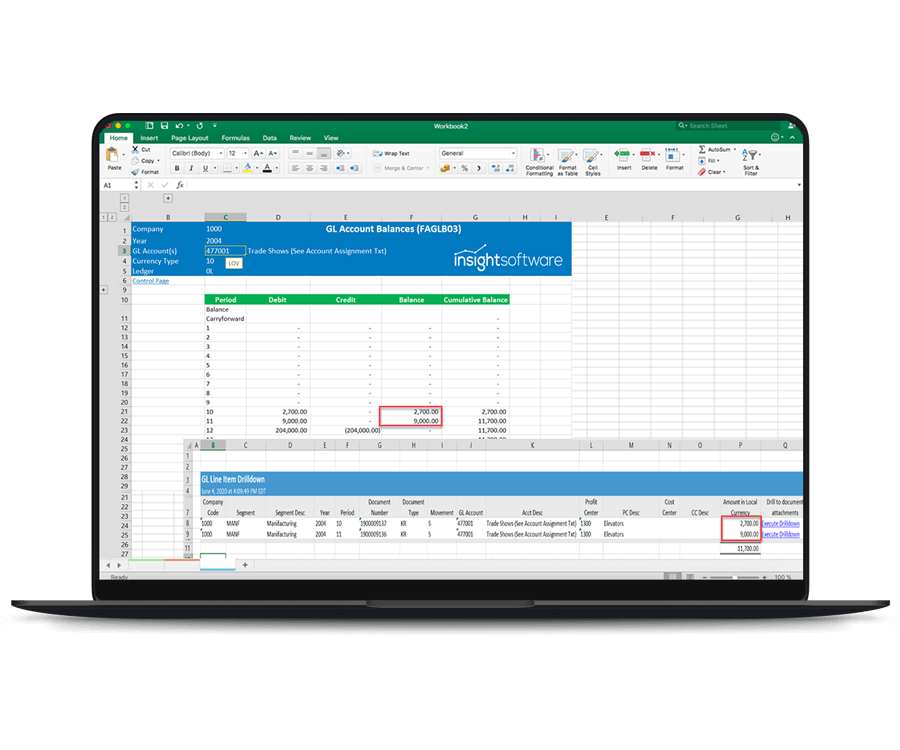
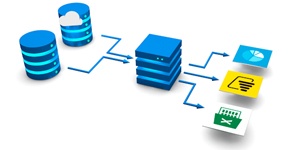
Whether you are using Oracle EBS, Microsoft Dynamics, SAP, Sage, or another ERP, streamline report creation with a solution that pulls directly from multiple data sources. With ERPsmarts that use a direct, real-time connection to understand your data, you can drill into cost of goods sold, balances, conversion rates, and average basket size to find and quickly fix reconciliation or data integrity issues and get fast answers to critical questions.
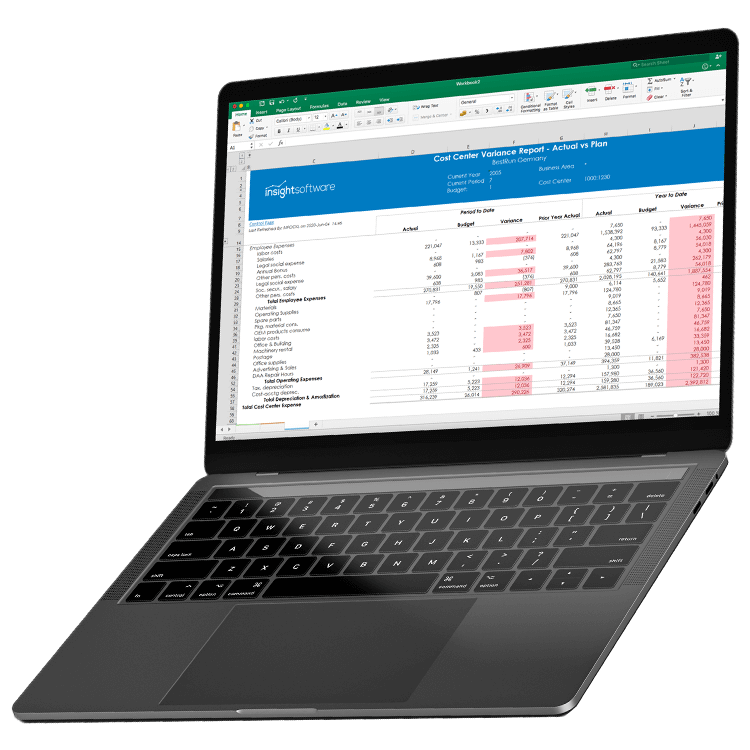
Tackle One-Off Questions with Ease
Create ad hoc reports on turns, margins, and inventory shrinkage, then drill down into the detail to answer questions from other departments and decision makers. Create and format your reports exactly how you need them.
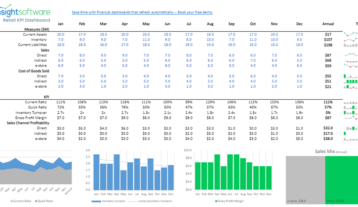
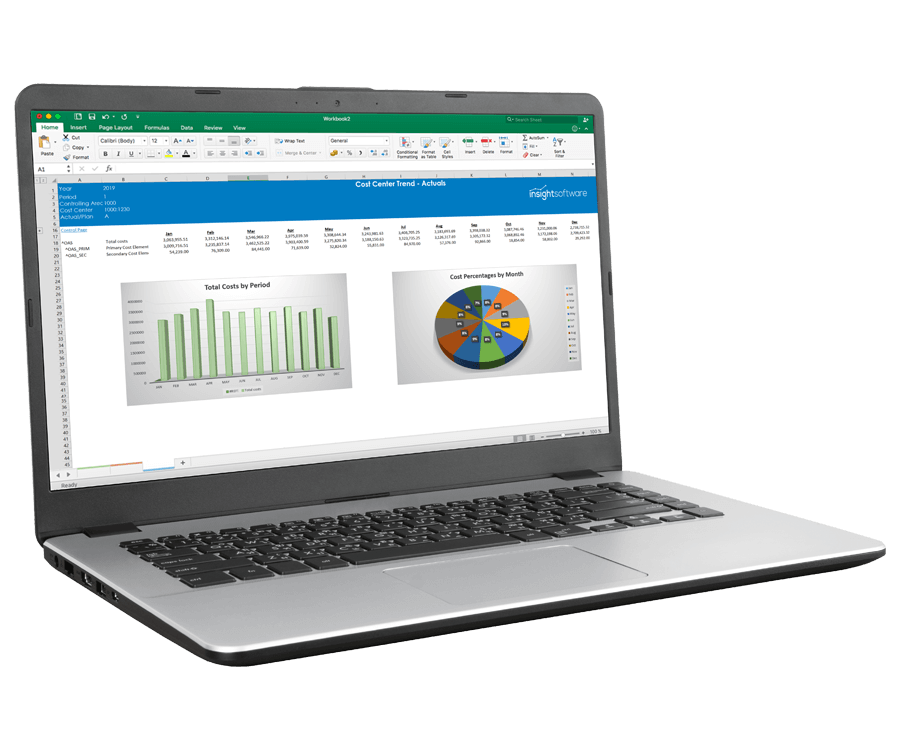
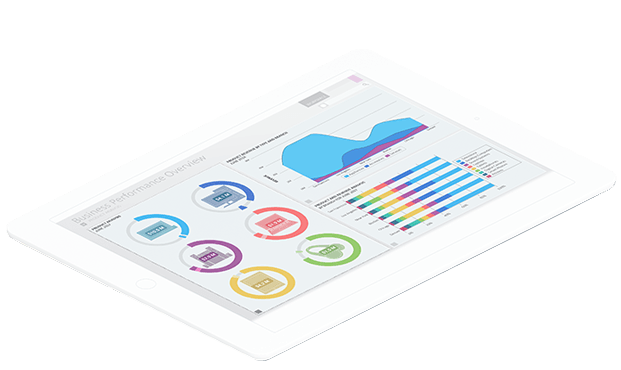
Visualize Key Metrics and Enable Accurate Retail Forecasting
Create visualizations and view dashboards to easily analyze profitability and sales performance. Pull in data from other business systems or databases seamlessly to enable accurate forecasting and monitor seasonality and trends. Simplify the budget and planning process by providing decision makers with the key data they need in a visual format they can easily digest.
Integrates with:
- Oracle E-Business Suite (EBS)
- Oracle EPM Cloud
- Oracle ERP Cloud
- Oracle Essbase
- Oracle Financial Consolidation and Close (FCCS)
- Oracle Fusion
- Oracle Hyperion Enterprise
- Oracle Hyperion Financial Management (HFM)
- Oracle Hyperion Planning
- Oracle PeopleSoft
- Oracle Planning and Budgeting Cloud Service (PBCS)
- Oracle Tax Reporting

- Dynamics 365 Business Central
- Dynamics 365 Finance and Supply Chain Management
- Dynamics AX
- Dynamics CRM
- Dynamics GP
- Dynamics NAV
- Dynamics NAV C5
- Dynamics SL
- SQL Server Analysis Services (SSAS)


- Deltek Ajera
- Deltek Maconomy
- Deltek VantagePoint
- Deltek Vision
- Deltek Vision Cloud

- Viewpoint Spectrum
- Viewpoint Vista

- MRI Commercial Management
- MRI Financials
- MRI Horizon
- MRI Horizon CRE
- MRI Qube Horizon
- MRI Residential Management
- Epicor Avante
- Epicor BisTrack
- Epicor CMS
- Epicor Enterprise
- Epicor Epicor SLS
- Epicor iScala
- Epicor Kinetic
- Epicor LumberTrack
- Epicor Manage 2000
- Epicor Prophet 21
- Epicor Tropos

- Infor CloudSuite Financials
- Infor Distribution SX.e
- Infor Financials & Supply Management
- Infor Lawson
- Infor M3
- Infor System21
- Infor SyteLine
- Sage 100
- Sage 100 Contractor
- Sage 200
- Sage 300
- Sage 300 CRE (Timberline)
- Sage 500
- Sage 50cloud Accounting
- Sage AccPac
- Sage Adonix Tolas
- Sage Estimating
- Sage Intacct
- Sage MAS
- Sage X3
- 24SevenOffice
- A+
- AARO
- AccountEdge
- Accounting CS
- Accountmate
- Acumatica
- Alere
- Anaplan
- Aptean
- Assist
- ASW
- Aurora (Sys21)
- Axion
- Axis
- BAAN
- Banner
- Blackbaud
- BlueLink
- Book Works
- BPCS
- Cayenta
- CCH
- CDK Global
- CedAr e-financials
- CGI Advantage
- Clarus
- CMiC
- CMS (Solarsoft)
- Coda
- Coins
- Colleague
- CPSI
- CSC CorpTax
- Custom
- CYMA
- DAC
- Data Warehouse
- Datatel
- DATEV
- Davisware Global Edge
- Davisware S2K
- Deacom
- DPN
- e5
- eCMS
- Eden (Tyler Tech)
- Emphasys
- Entrata
- Etail
- Expandable
- FAMIS
- Famous Software
- Fern
- FinancialForce
- FireStream
- FIS
- FiServ
- Flexi
- Fortnox
- Foundation
- Fourth Shift
- Friedman
- Full Circle
- GEMS
- Harris Data (AS/400)
- HCS
- HMS
- IBM Cognos TM1
- IBS
- IBS-DW
- In-House Developed
- Incode
- INFINIUM
- IQMS
- iSuite
- Jack Henry
- Jenzabar
- JobBOSS
- Jonas Construction
- M1
- Macola
- MACPAC
- Made2Manage
- MAM
- MAM Autopart
- Manman
- Mapics
- McLeod
- MEDITECH
- MFG Pro
- MicrosOpera
- MIP
- Mitchell Humphrey
- Movex
- MRI
- MSGovern
- Munis (Tyler Tech)
- New World Systems
- Onesite
- Onestream XF
- Open Systems
- PDI
- Penta
- Plexxis
- PowerOffice
- PRMS
- Pro Contractor
- ProLaw
- Q360
- QAD
- Quantum
- Qube Horizon
- QuickBooks Desktop Premier
- QuickBooks Desktop Pro
- Quickbooks Enterprise
- QuickBooks Online
- Quorum
- RealPage
- REST API
- Retalix
- Ross
- SmartStream
- Spokane
- Springbrook
- Standalone DB with ODBC/DSN connection
- Standalone IBM DB
- Standalone Oracle DB
- Standalone SQL DB
- SUN
- Sunguard
- SunSystems
- Sys21
- SyteLine
- TAM (Applied Systems)
- Thomson Reuters Tax
- Timberline
- TIMELINE
- Traverse
- TripleTex
- Unit4
- Unit4 Agresso
- Unit4 Business World
- Unit4 Coda
- USL Financials
- Vadim
- VAI-System 2000
- Vantage
- Vertex
- Visma
- Winshuttle
- Wolters Kluwer CCH Tagetik
- WorkDay
- Xero
- xLedger
- Xperia
- Yardi
- Yardi-SaaS
Simplify and Speed Up Financial Report Creation
Whether you’re a spreadsheet expert or new to the business report world, download our Top 10 Best Practices for Retail Reporting in Excel guide to help streamline your report creation process.
Learn How to:
- Make reports more interactive
- Increase report usability
- Tailor reports for your audience
- Prevent unwanted spreadsheet errors
Work with the #1 Retail Reporting, Analytics & Dashboard Software Vendor

"Jet Analytics is a solution that the business is comfortable with. The information it presents is consistently valuable, has a real impact on business direction, and because it updates from our core systems every half hour, it keeps an accurate finger on the pulse of the company.”

Speak to an Expert