Success story: How CNHi uses Vizlib to accelerate the adoption of Qlik Sense

CNHi is a giant in the worldwide capital goods market. They design, produce and sell agricultural and construction equipment, commercial vehicles and powertrains for marine and industrial applications. This major player has over 64,000 employees, 66 manufacturing plants and 54 R&D centres in 180 countries.
Naturally, such a large enterprise works with a colossal volume of data. And, though their data users share a strong analytics culture, not all the users have the level of understanding necessary to work with and analyse data effectively. Since the organisation wanted to speed up the time it took from insights to action for all data users, they recognised the need to improve their data democratisation.
Data democratisation is the process of making data accessible to all data users in a business. The goal of data democratisation is that anyone can use data at any time to speed up the decision-making process and unlock new insights and opportunities for the business.
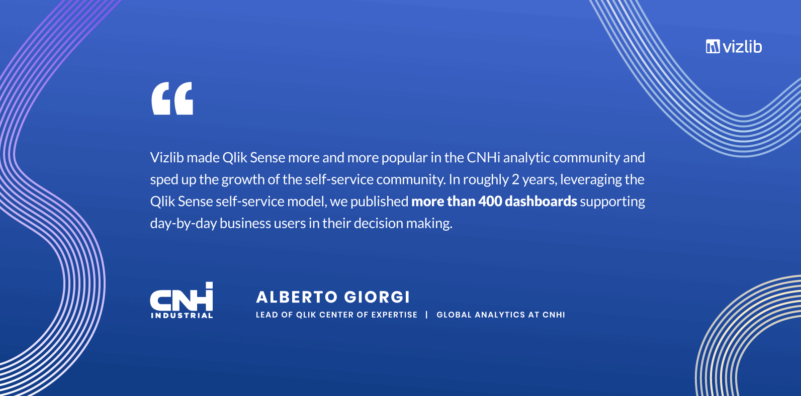
We’re speaking to Alberto Giorgi, who leads the Qlik Center of Expertise – Global Analytics at CNH Industrial, about the impact of strategic BI solutions on self-service analytics and data literacy levels in their organization.
“Users in CNHi have a very strong analytics culture. BI and analytics play a very important role,” Giorgi begins.
And with this underlying culture of embracing analytics, fostering a growing curiosity for using data in the broader workforce seemed a natural progression for the business.
Unfolding the data democratization process
CNHi sought to encourage more employees to use data in their daily roles. Yet, as a forerunner, the users needed to understand the data and the analysis tools before they became confident data users. The business required additional focus on the democratisation of data and, to successfully achieve this goal, they co-developed a three-phase approach.
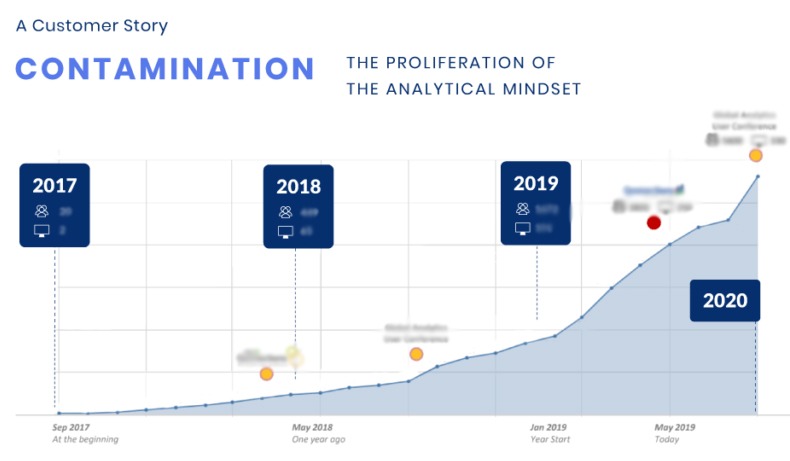
Phase 1, or the Contamination phase, of the roadmap commenced with fostering an analytics mindset among the workforce. This really kicked off in 2017, with the deployment of Qlik Sense BI solutions to a 20 member analyst team. In 2018, this analytical drive expanded to 450 data users.
Once this phase wrapped up, phase 2 entailed the establishment of a CoE central governance or the control phase. The team achieved this by developing the right enterprise structure to support data literacy and then instilling the governance necessary to manage it effectively.
And the final phase was all about the users, empowering them to use data confidently to create tailor-made visualizations.
Users get the customization to create compelling, branded dashboards
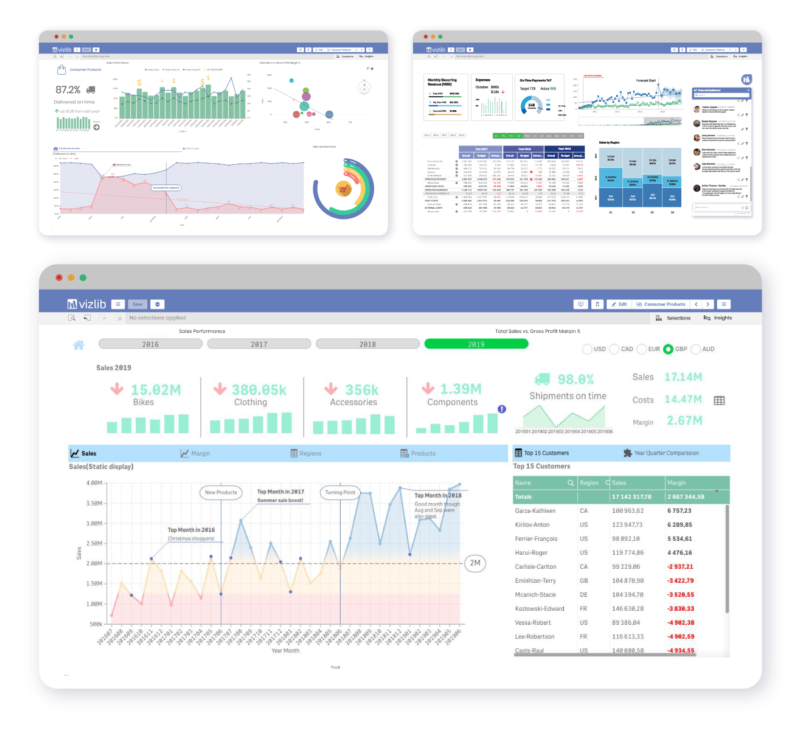
Vizlib dashboards
The final data democratisation phase for CNHi, the humanisation step, was where the data and humans truly came together. The enterprise had to ensure everyone had access to data in a way that was understandable and matched their data literacy level.
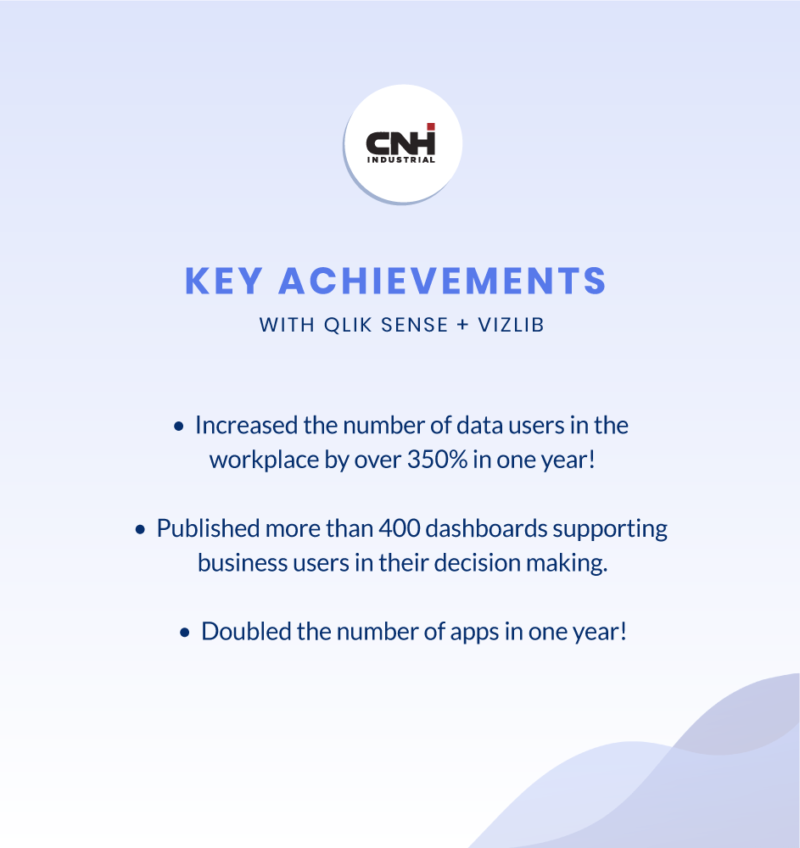
During this time frame, big changes occurred. By 2019, the number of data users deriving business value from data had grown to over 1600, when Vizlib’s value-added products for Qlik Sense were introduced to the business. And, by 2020, the number of people in the workforce empowered to use, think with and analyse data had boomed to 7500 users – a whopping increase of over 350% in one year!
Since different BI solutions offer different capabilities, the team had to ensure their data goals would be served. And, for CNHi, customisation was the essential factor for their analytics roadmap.
“What brought us to use Vizlib was the lack of visual objects in-bundle with Qlik Sense. Vizlib offered a very interesting set of additional value-added products, and capabilities within those products, that for our business users was a ‘must-have’,” Giorgi affirms.
Vizlib supported CNHi by providing easy-to-use, appealing visualization capabilities for Qlik Sense that required no coding experience and enabled high levels of customization. The ability to customize every chart just the way they wanted it empowered users to develop compelling, branded dashboards.
A major component, which was a hit with the users, was the deployment of the Qlik Data Concierge – an advanced self-service solution based on the re-usability of data source specific structures and metadata.
The data concierge helped data users quickly find what they were looking for through an easy-to-use catalogue. The catalogue, composed of two categories: Dimensions and Measures, enabled users to select the relevant data points to tell their customized data story. Consequently, these data citizens now had the capacity to build their Qlik Sense apps by choosing their data visualizations and getting the right insights on the fly. And the confidence to continue using data in their daily roles.
In addition, CNHi received fully-supported service throughout their data democratization journey with Vizlib – both responsive and effective technical support.
Currently, CNHi uses the Vizlib Library and Vizlib Self-Service offerings. And they have found Vizlib’s Filter, Advanced Text Object, Table, Pivot Table, Container, Sheet Menu, BarChart and ComboChart particularly useful in improving their data analytics pipeline.
The visual appeal of Vizlib’s capabilities, the ability to customise each object to our particular business needs and the prompt support we received certainly set Vizlib apart.