How Vizlib enhances data visualization for CONTEXT and their customers


In order to provide their customers with the best quality data, actionable insights, and Agile analysis, CONTEXT relies on great insight from data science and visualization tools. The team at CONTEXT uses Vizlib’s solution to expand the Business Intelligence capabilities of Qlik. We met with Nick McGuigan, Analytics Design Manager at CONTEXT, to reflect on how Vizlib’s data visualization and analytics solutions have supercharged the team’s processes.
How Vizlib enhances Qlik Sense’s capabilities
In their own words, ‘[CONTEXT] enables you to make informed Business Intelligence decisions today and plan for tomorrow. For over 35 years, technology vendors, distributors and retailers have trusted our data to inform commercial decisions and solve business challenges.’
In order to make this possible, the team at CONTEXT must stay up to date with the latest Business Intelligence, data science and data visualization technology. CONTEXT identified Vizlib as a great match for their needs when their data visualization tool, QlikView, migrated to Qlik Sense. Some of the business analytics and data visualization capabilities were lost during the tool’s migration.
We used QlikView for a very long time, and lots of the things that we were doing with QlikView were no longer possible in Qlik Sense. So it was quite difficult to transition customers over from QlikView to Qlik Sense.
Vizlib reinstated the capabilities of the tool. This meant that the team at CONTEXT was able to continue their usual data visualization and Business Intelligence processes with minimal disruption, despite the changes from Qlik. Nick said:
We use Vizlib’s Sheet Menu, filter objects, the bar chart, line chart, bubble, advanced text button, combo chart, shot container… You name it, we use it.
Improved navigation for users
Adopting our branding into the tool via the Sheet Menu was hyper important to us… because we have our reports that exist within our own portal. The customer logs in and then goes from there, into the app and to have continued continuity of the marketing.
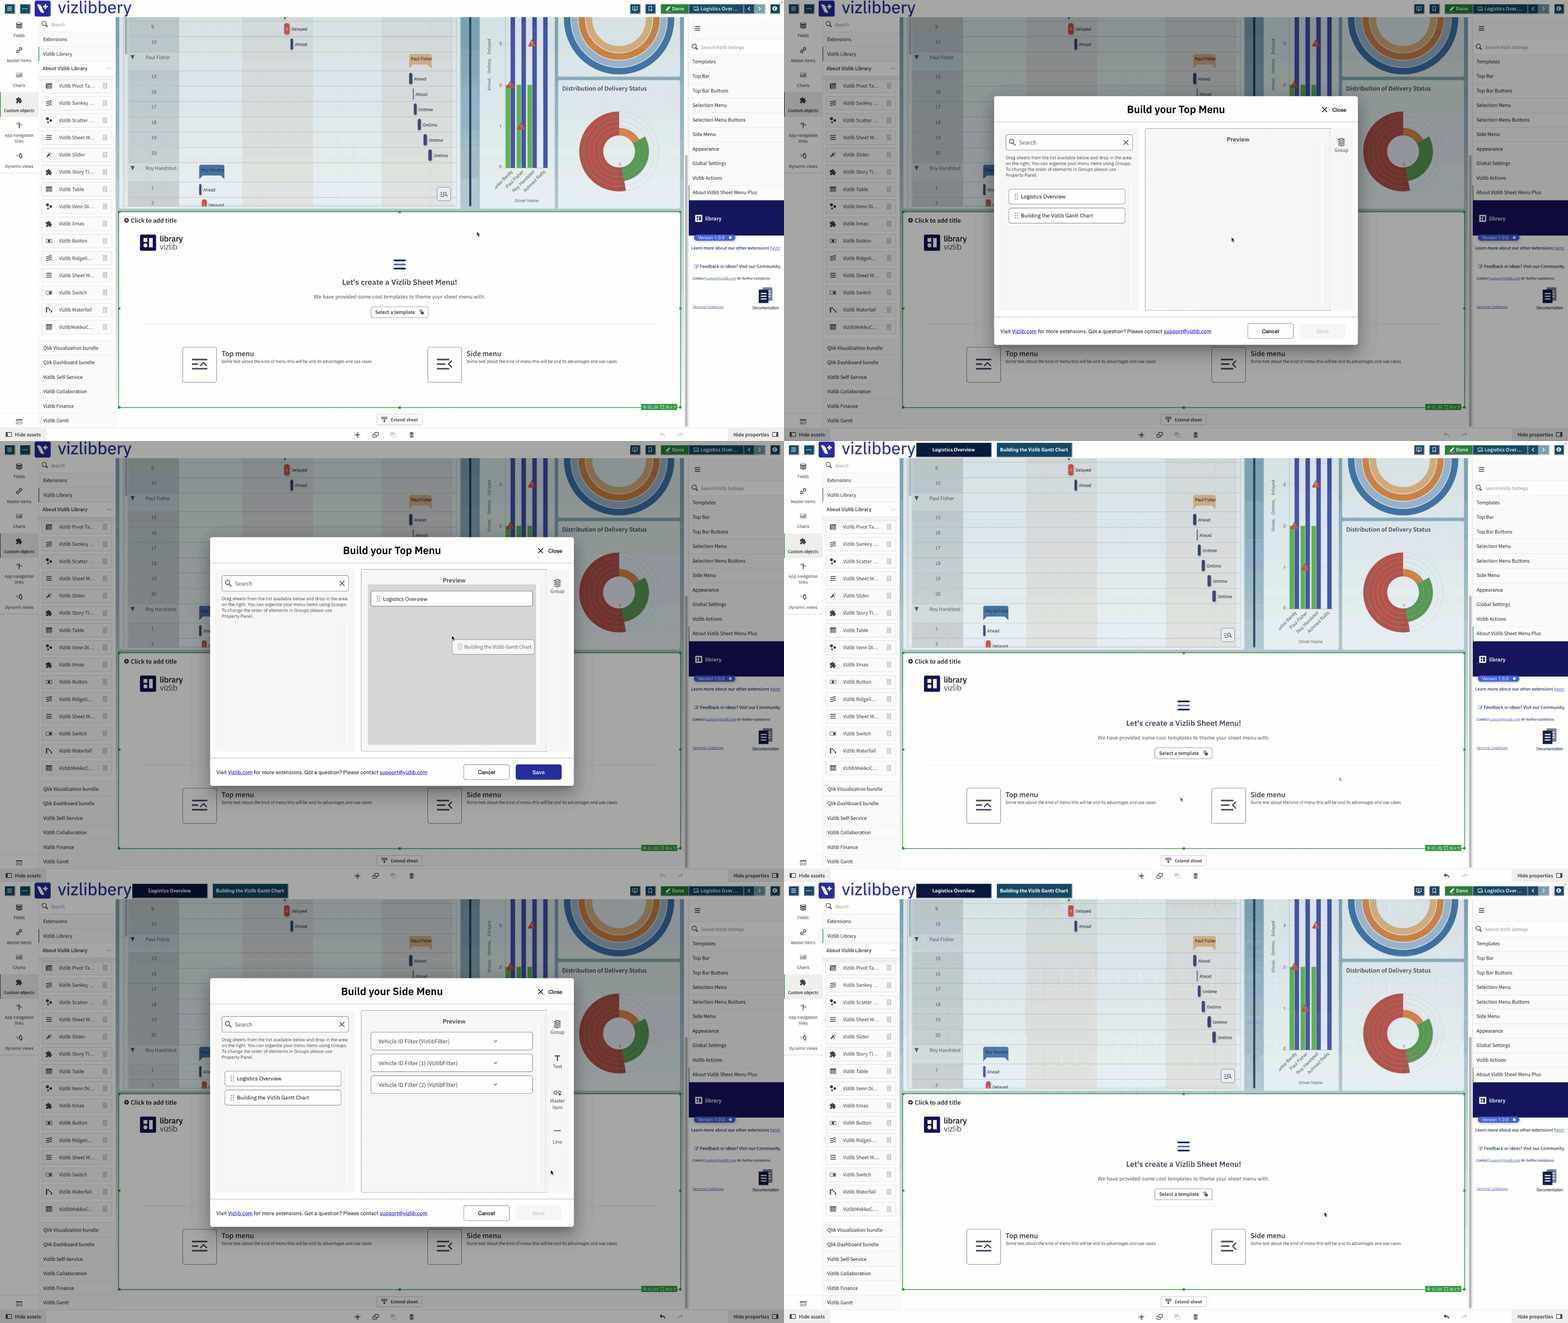
Vizlib Sheet Menu is a tool that enables teams to create a web-like user experience within a Qlik Sense dashboard. It is designed to make it quick and easy for users to navigate between groups and sheets.
The team at CONTEXT uses Vizlib Sheet Menus to help their users navigate dashboards more intuitively. What’s more, the CONTEXT team has the ability to customise, style and format Vizlib Sheet Menu items to suit their brand. This means that their users can enjoy a consistent, clear and familiar experience.
The Sheet Menu has to be one of the biggest functionality improvements on the “vanilla” Qlik Sense for us, because we can adopt the same branding [and] we can change how the navigation works. So, the Sheet Menu makes that really fantastic and makes that possible.
New ways to present data visualizations
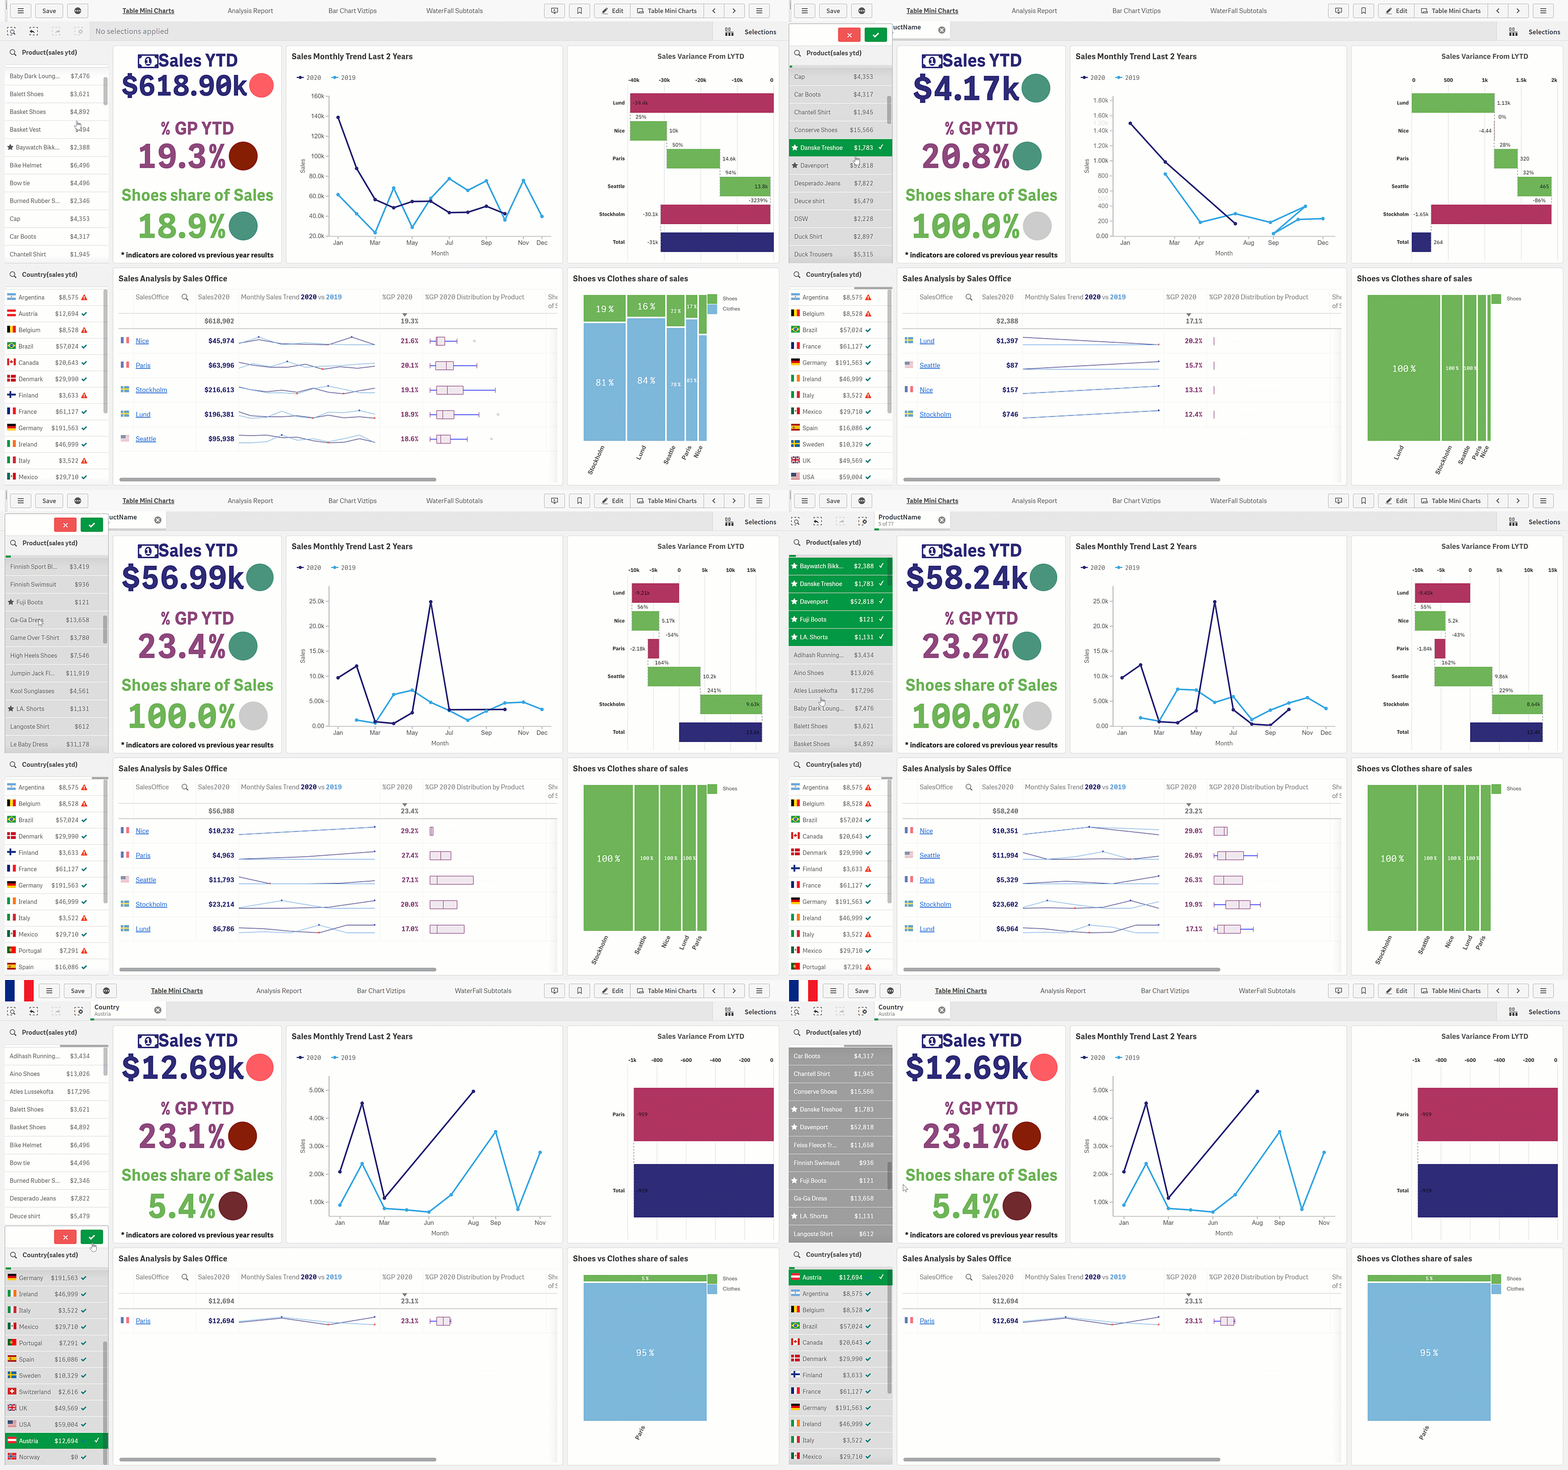
Using Vizlib has also enabled the team at CONTEXT to create more impressive-looking dashboards with improved functionality. They use filters within their dashboards to control the selection of data that is displayed. This helps the user to focus on the data that the team wants to highlight when handling large data sets.
In this way, the team at CONTEXT can ensure that they create visualizations that are effective, fit for purpose and easy to understand. What’s more, Vizlib tools such as Bar Chart enable elements to be overlapped to make the best use of the space, while still highlighting all of the key takeaways. As Nick explains,
We like to have lots of filters in the sheet and the dashboards. But obviously this takes up a lot of space. Some of the Vizlib extensions make it possible to… count and overlap the objects. So those are really important, that’s critical functionality for us.
Summing up
CONTEXT is one of many Vizlib customers that lost functionality during the QlikView migration to Qlik Sense, but has since regained and even expanded the possibilities of data visualization within Qlik with Vizlib’s purpose-built solutions. To expand what’s possible with Qlik Sense, explore the suite of value-added products from Vizlib. Start your free trial today!
We like to have lots of filters in the sheet and the dashboards. But obviously this takes up a lot of space. Some of the Vizlib extensions make it possible to… count and overlap the objects. So those are really important, that’s critical functionality for us.


