Qlik and Vizlib:
Adding more visual power to native Qlik Sense

![]()
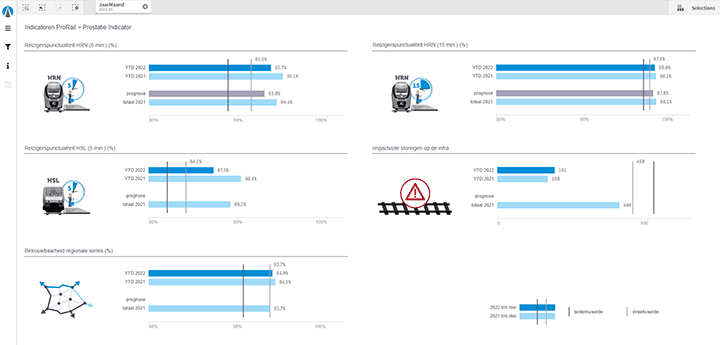
Managing critical data with Qlik
Managing and analysing data that directly affects the safety of millions of people would be a daunting task for some. But Prorail has effectively used Qlik analytics with Vizlib to leverage data for just that purpose.
Since they’re dealing with such critical data, KPIs are a crucial visual component of their business intelligence. “We have certain KPIs that we measure and have to report on. And this reporting is done via our Qlik solutions,” Marten Louisse, a Business Intelligence Developer at ProRail, explained.
Along with reporting externally to government stakeholders, the company uses Qlik Sense for reporting on daily operational insights.
But not all of their reporting was always performed in Qlik Sense. Prorail was recently faced with the task of migrating their key data from QlikView to Qlik Sense. “We had a really extensive QlikView landscape that was important for decision-making, with so many essential KPIs reported by the landscape and all the reporting tools we had connected to it. It had a prominent place in the organization.”
So how did they manage the transition and maintain the analytics functionality they needed?
“In order to keep all the essential functionalities intact, we needed something that could offer more than standard Qlik Sense objects could. And in that way, Vizlib has really helped us out!” Marten shared.
![]()
Adding more visual power with Vizlib
“A couple of years ago, we did a proof of concept when we started thinking about migrating our QlikView products to Qlik Sense. But with the standard Qlik Sense functionalities, we were missing some key functionalities.”
They were missing the additional QlikView features such as conditional formatting, actions, and a wide range of customisation options. They knew they’d need to find alternatives to continue producing quality visualizations for their analysis.
Luckily, the team was able to upgrade their Qlik solution quickly and smoothly. Thanks to the added functionality and customisation of Vizlib, they could easily maintain all their critical data and daily reporting, internally and externally.
“With Vizlib Library, we were really able to have one-for-one the same functionalities that we were used to. And it also makes it a lot easier for our users to get used to the new dashboard. So, yeah, Vizlib really helped a lot with the migration process.” Marten Louisse, Business Intelligence Developer, Prorail

The added benefits of Vizlib in their BI
In response to how Vizlib has helped the company, Marten responded, “In general, it just works very well. The user interface is intuitive.”
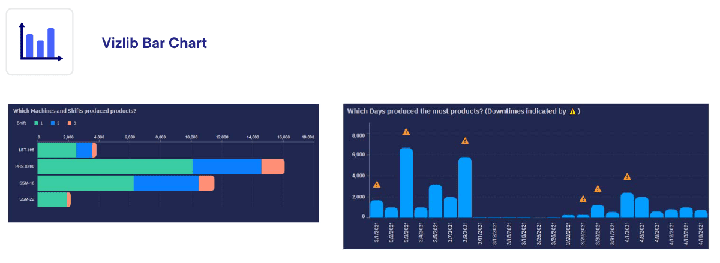
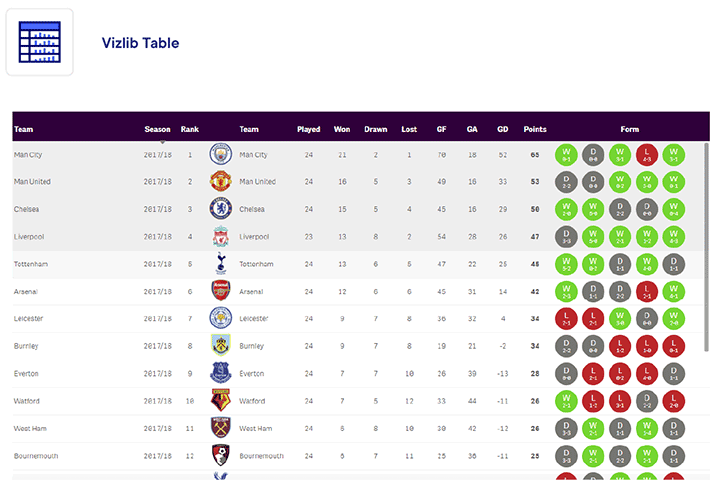
And when it comes to what Prorail considers their favourite Vizlib product, Marten shared that Vizlib Library was at the top of the list. “We use many of the Library extensions, including Vizlib Line Chart, Bar Chart, Table and Pivot Table, and Container Grid”
Vizlib Table and Container Grid have been integral in easing their transition from QlikView to Qlik Sense – re-creating some of the dashboards that contain many conditional show functions in QlikView. “In QlikView, we used a lot of columns just for calculations, where they’re hidden in the visualizations, but used to calculate other columns.” And they found this particular function lacking in Qlik Sense. Luckily, they could “do the same thing in Sense now with the Vizlib objects. So it was easy to migrate.”
Marten also praised Vizlib’s customer service and support:
“The customer service is really good. We are really happy with that. When we have a problem, we know we can always address it. Plus, the follow-ups are really good.” Marten Louisse, Business Intelligence Developer, Prorail

A brighter visual future with Vizlib
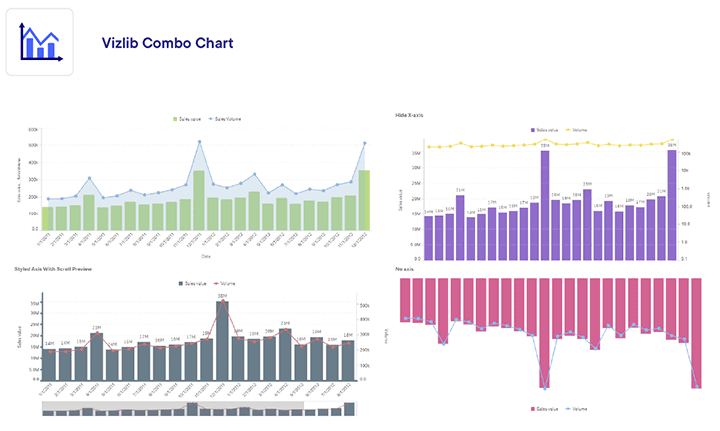
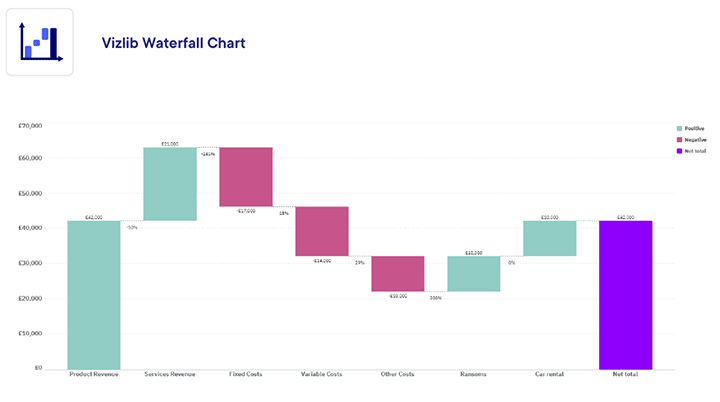
When it comes to the future of Prorail’s analytics journey, Martin said they plan to still try additional Vizlib Library extensions. And “find out about potential opportunities to further optimize the data insights and customer experience, such as Vizlib Sankey Chart, Flow Chart, Heatmap, Waterfall Chart, Ridgeline Plot, and Combo Chart for example.” Also, Trellis Mode in Vizlib Self Service.
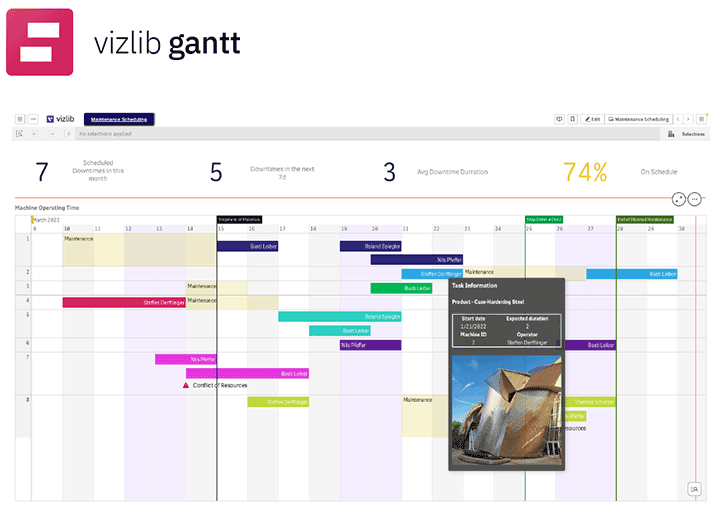
Plus, Vizlib Gantt is also on their radar. “We’ve been using it already for two or three projects but in just the simple functionalities for now. But, we have a bigger project coming up, so that’s the most important I think.”
And they’ll also be looking into predictive modeling in the near future.
With easy, supported access to such a comprehensive toolkit with Vizlib, Prorail’s analytics journey – much like the rail journeys they manage every day – promises to be both exciting and efficient.
The customer service is really good. We are really happy with that. When we have a problem, we know we can always address it. Plus, the follow-ups are really good.