Qlik + Vizlib: streamlining reporting and extending app usability

Resolving the limitations of Qlik native
Tectum Group was initially using QlikView to manage their operational data. But since that “wasn’t very expandable with features and tools,” Thomas shared, the group decided to upgrade to Qlik Sense. “We went to Qlik Sense so we could make better applications and get better data insights.”
Though Tectum has been using Qlik Sense now in their Finance, Sales, and Logistics departments, they found that the upgrade didn’t entirely solve all their use cases. “With Qlik Sense, we still had limitations in some fields.” Particularly with a rapidly growing database, linking processes across their value chain, and data feeding in from across Europe.
They knew without a doubt they needed more from their data analytics solution when they discovered Vizlib’s visual analytics power. And finally, their Business Intelligence could support the speed of their growth – with Vizlib added to their analytics mix!
The finance team was the first to benefit from adding Vizlib to their Qlik apps. Since the team needed to adjust financial data quickly, it wasn’t viable for them to do it in a source table because it takes too long. And that led them to “look for something that they can adjust real quick and see the impact in the decisions they make.”
They needed functionality beyond native Qlik Sense that would enable them to input data directly.
In considering the most suitable service provider, their buying decision included Vizlib and one other analytics provider. Ultimately, Tectum chose Vizlib because of its unique ability to expand the visual functionality of Qlik Sense. “We made a comparison and went with Vizlib for the extensibility that can be used with visualizations.”
From spreadsheet chaos to a replicable model for all departments
The finance team was the testing ground for adding Vizlib’s input and visual power to their Qlik analytics. And from there, other departments also started using Vizlib to get more from their data apps.
Thomas explained that the finance team has “a really big application that includes between 18 and 24 Qlik applications – a budget calculator.” And thanks to Vizlib, those complex processes are now handled smoothly.
Their journey with Qlik + Vizlib may have started with finance, but soon burgeoned to many other departments!
How Vizlib helped Tectum achieve their business intelligence goals
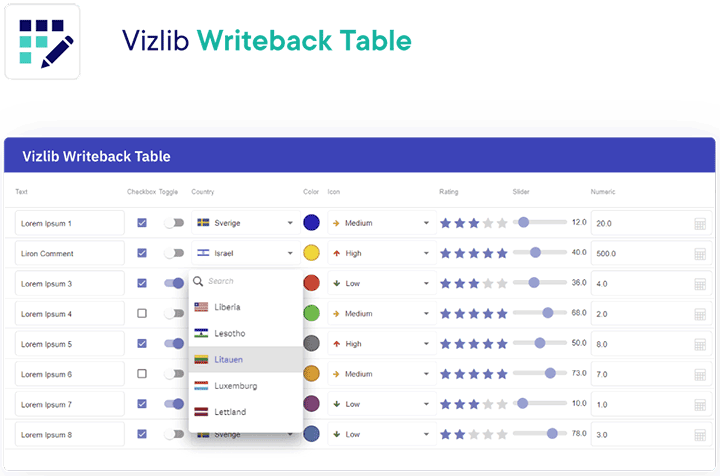
Regarding which Vizlib products they’re using, Thomas shared, “At the moment, it’s mostly Vizlib Collaboration. So the writeback capabilities, like Writeback Table and Input Form.”
And they’re certainly making good use of the ability to input data on the fly with Vizlib’s writeback features. “The Writeback Table is common in most of our applications. Also, the Input Form is really helpful for sales department lists, for example. After a client call, they can update the database immediately.”
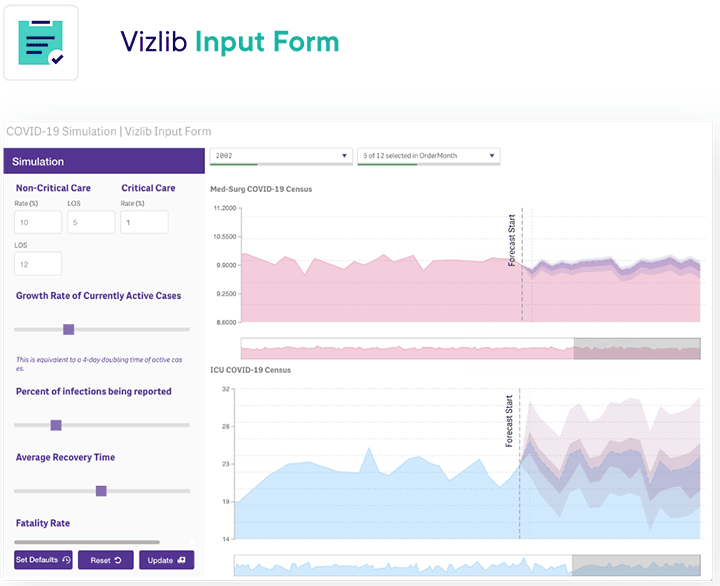
They also use the Input Form extensively in finance for their budget calculator. Thomas explained how it saves them time. “The finance manager selects a few companies in the Input Form that have to be filled in. They then fill in any notes in the text box. And if the info was submitted with a quote, it will automatically send an email to the users requesting they fill in their company information.”
The business also finds that the Writeback Table features cover a broad number of use cases. “It’s not just to fill in a line. You can add conditional formatting, calculate columns, and link fields across apps with the Associated Fields feature.”
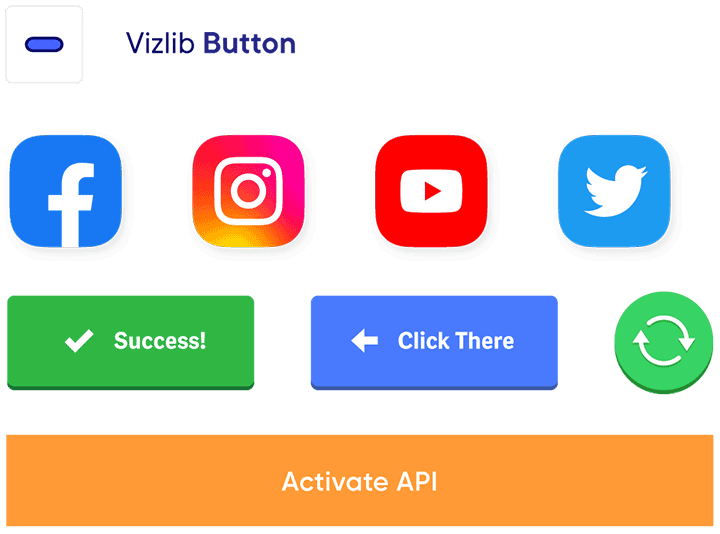
Along with Vizlib’s collaboration tools, they also use Vizlib Library, enjoying the range of options with Vizlib Button, for instance. “You have many options you can choose. And it’s not just to navigate to the other sheet or to open an older application. You can indicate an API. That was something we were looking for, so we’re really glad that was available.” Plus, they’ve also “implemented API in some buttons to send data to other systems or to start up PowerShell scripts and our servers.”
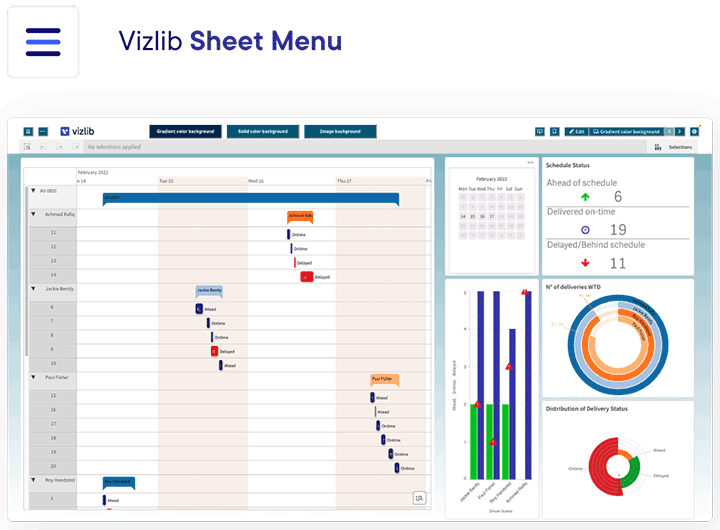
Tectum Group also uses the Sheet Menu in Vizlib Library to streamline how their teams navigate their Qlik dashboards.
Next steps in their analytics journey
“I think the next step will be more about Predictive Analytics,” Thomas concluded. And liked the fact that “in your live visualizations, you can already enable predictive analytics.”
In the true spirit of innovation, Tectum Group found the most favourable solution to their analytics needs with Vizlib, and replicated the success across their business – improving their operations and driving continual business growth.
“Previously, we had to send more than 100 Excel spreadsheets by email, which was chaotic. And now with the Vizlib and Qlik combination, the finance manager can see everything in his application, can make adjustments really quickly, and can see any changes that were made.”