DAC uses dashboards for internal analytics as well as externally for their clients. “We have to have dashboards that serve all of us,” Kuhan Puvanesasingham (Business Intelligence Manager, DAC Group) explained.
Internally, they create dashboards to help manage operations, including budget pacing and campaign optimizing. External reporting is all about providing their clients with regular campaign performance updates.
“We’ve always created reports with Qlik Sense. But we’ve been hitting a wall with the level of user experience and that’s where we turned to Vizlib to elevate our reporting,” Kuhan shared.
Dashboarding and reporting are a fundamental part of the services DAC Group offer. Every engagement they have as an agency includes an aspect of reporting. And to be the best service provider in their industry, DAC must be able to generate first-rate reporting for their customers. “If we’re going to be spending client money, we have to report on it.”.
When it came to finding the perfect partner to level up their reporting, DAC made every effort to find the solution that best suited them, and their customers. Some of their clients and employees were originally using a free analytics product. But they found the performance poor as the software couldn’t handle big data. It lacked all the ‘under the hood mechanics’ that Qlik has. And people were disappointed in the look and feel of the dashboards.
What they needed was more visual power for their analytics. “We love that Qlik Sense offers what you need on the functional side, but it really couldn’t compete with some of the alternatives.” Then, they had their ‘aha’ moment… after seeing a Vizlib demo. “That’s when we thought – let’s explore how we can make Qlik Sense compete visually with the other platforms.”
And from then on, they’ve been hooked on Vizlib. “Once we got a sense of what Vizlib was able to do, it just opened up our workflows.”
Getting more value from data with Qlik + Vizlib
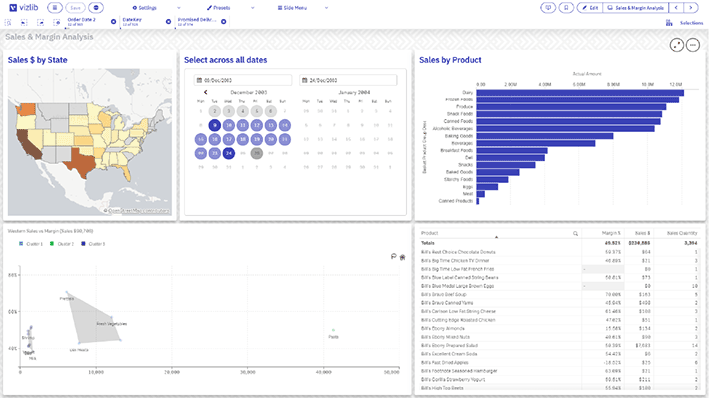
“Qlik Sense is the backbone of all of our visualization and email analytics,” Kuhan highlighted. But with Qlik plus Vizlib’s value-added products, the team can “create visualizations and dashboards that help our internal team and our clients make better business decisions on how they spend media, how we optimize media, and how websites are performing.”
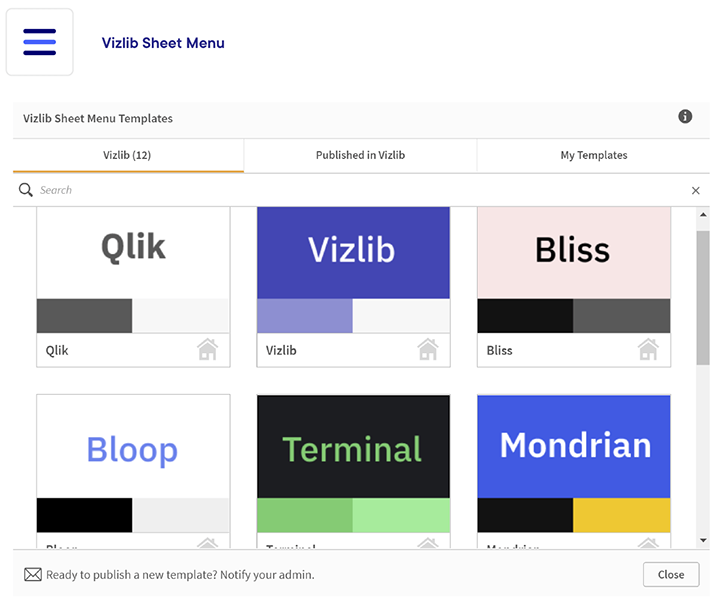
With Vizlib’s customisation options, they can now also offer dashboards that match a client’s color scheme and design expectations. Plus, their clients are “really pleased that it’s a familiar interface for their stakeholders.”
But the big one is a large US Insurance company, the DAC Group explains. “We built a Qlik Cloud app with thousands of weekly users connecting to one directory. A third of our company’s functions were involved in this project.” And since it was such an important client, they knew they had to produce stunning dashboards, as competition is tough. However, the DAC team was not satisfied with the visual quality of the report with Qlik’s native functionality.
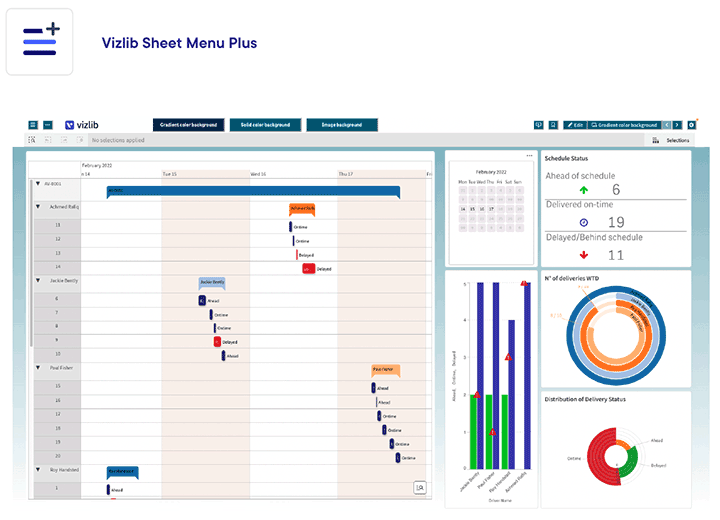
And that’s why they added Vizlib to their Qlik analytics. The combination of Qlik and Vizlib’s customizability empowered their design team to create a compelling and professionally styled visual data story that met the client’s business needs and beyond!
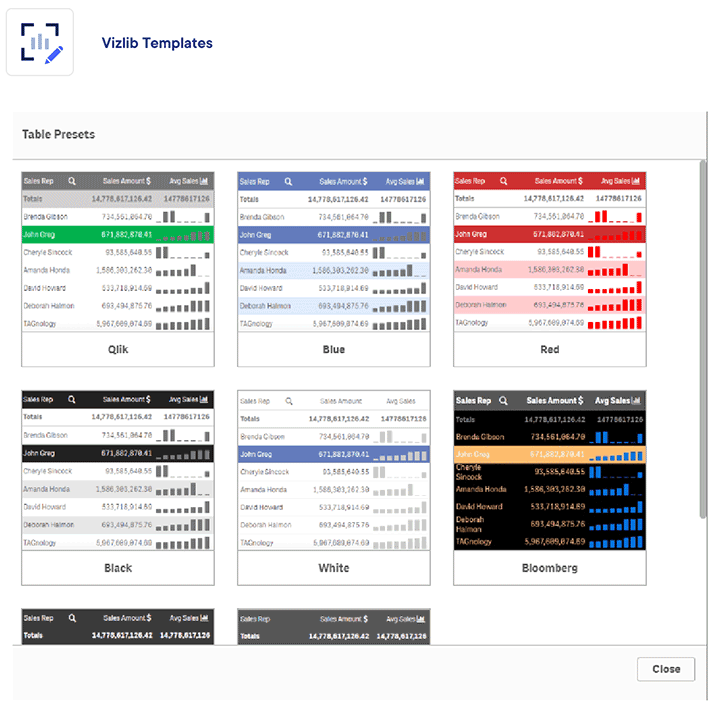
Another favorite for the DAC team is Vizlib Templates. With this capability, they now create professionally styled dashboards and can develop them much faster too. “When we get new clients, we can produce quality dashboards really quickly, and everybody seems really happy.”
Beyond adding value to their Qlik analytics as a service provider, Vizlib is fast becoming a true partner for their whole business – supporting and boosting their core services. With Vizlib’s visual capabilities, DAC has streamlined their sales process and now showcases (and even shows off) their dataviz capabilities. “When we show screenshots and demos of our existing products, the sales process is a lot better.”
For instance, they recently created a Qlik Cloud usage dashboard for one of their big clients. “And the usage happens to be really healthy,” Kuhan adds. So the combo of Qlik and Vizlib “helps our sales and increases the usage of our work amongst our clients, which is always good for business retention!”
With the right data visualization in the mix, DAC confirms:
“We can create products that we’re proud of. People use it more, and it helps us generate more business.” Kuhan Puvanesasingham, Business Intelligence Manager, DAC Group
Vizlib extensions that move the needle
Vizlib Library is the main product the DAC Group uses. “That was how we started this relationship,” Kuhan shared.
“And we haven’t even used Library to its full potential yet. We’ve revamped our standard dashboard offering. And even with that, there are already 10 visualizations that we now can’t live without.” Kuhan Puvanesasingham, Business Intelligence Manager, DAC Group
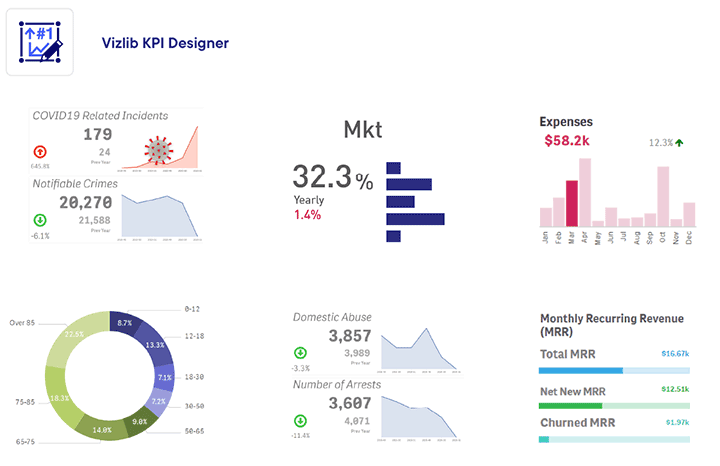
Another Library extension they love is the KPI Designer, a tool to create customized KPI Objects in Qlik Sense. (You can even add objects such as an image or a gauge as different layers). “That’s a core one. It’s the most powerful and flexible,” Kuhan reiterated.
Vizlib support – when you need it most
DAC also complimented Vizlib on the level of support they receive. “We’re talking same-morning response. We’ve had some of your technical people on the phone within an hour, which is unheard of with other companies.”
And we helped them solve or improve their Vizlib dashboards at critical times! “You’ve helped us solve issues at the last minute before we present something to a client. Typical agency life where we’re still fumbling around with something the night before it goes out.”
Plus, the team is looking into broader use cases, such as customer analytics. “We’re working on a project for a client that involves creating customer segments. And we’re confident that we can present polished-looking products to them with Vizlib.”
“So, yeah, we’re just getting started, now that we know the potential of Vizlib. We have definitely not exhausted what Vizlib is capable of yet,” Kuhan concluded.
And we haven’t even used Library to its full potential yet. We’ve revamped our standard dashboard offering. And even with that, there are already 10 visualizations that we now can’t live without.
Kuhan Puvanesasingham
Business Intelligence Manager
Get a Demo & Pricing
What to expect
20-minute discovery call with a product expert
Discover which solutions are best suited for your needs