Vodafone leverages Vizlib’s value-added Qlik solutions to wow its end users

When Vodafone created a dedicated Data Visualisation team within their Business Intelligence department 3 years ago, they were looking for a more effective and impactful way to communicate data. As one of the world’s leading mobile communications providers, operating in 26 countries and in partnership with networks in over 55 more, Vodafone had a lot of complex data that needed to be turned into insights. That’s when they decided to partner with Vizlib and let their data do the talking. We are chatting with Senad Music, Senior Manager BI Analytics at Vodafone, about the company’s journey with Vizlib and Qlik Sense.
Finding a solution that cuts through the noise
There are so many different sources that must be combined and explored to make meaningful discoveries. It’s hard work. And business users don’t really care how the data is sourced and visualised – as long as they get their answers in a neat and understandable format. Which means a solution that’s both powerful and pleasant on the eye is the only way forward.
“Data visualisation plays a much bigger role at Vodafone compared to 3 years ago when we started a dedicated Visualisation team within Business Intelligence, but it feels that we are still just scratching the surface of what is possible. Like any large, federated corporate organisation, there is a lot of complexity and visualisation simplifies the messages, cuts through all the noise to serve the relevant decision makers with clear and fresh insights.”
It’s quite common that BI teams end up having to build their own custom solutions to meet business requirements. And when that happens, choosing the right partners becomes a priority.
“Qlik Sense is one of our primary visualisation delivery engines for when an application needs to be available on mobile devices or when we are creating integrated mashups solutions with ‘writeback’ or notifications elements. The business largely doesn’t know (or need to) what technologies go into the mix as long as their ‘problem gets resolved’,” explains Music.
Further expanding on their approach to using technologies as “building blocks to deliver a wide range of agile business solutions”, Music talks about embracing Qlik Sense extensions.
Qlik Sense was and still is a relatively young tool and sometimes simply lacking features for which we don’t want to wait 1 or 2 years to appear. Extensions are like apps on your smartphone – you will never buy a phone that has pre-installed all the apps you will ever need.
“Data Visualisation simplifies the message and cuts through all the noise to serve the relevant decision makers with clear and fresh insights.”
Moving Faster with Vizlib
Talking about what Vodafone were capable of achieving as a result of deploying Vizlib’s value-added products for Qlik Sense, Senad Music was open:
“Vizlib gave us a significant development acceleration boost, saving us time by being able to leverage a comprehensive pack of value-added products ready to use while also giving us assurance around sustainability of the solutions we create.”
He continued: “We no longer need large numbers of developers being distracted with every new browser or Qlik release. Compatibility maintenance is now externalised at much lower cost as Vizlib maintains the same value-added products for many customers.”
As the appetite for powerful and slick-looking dashboards continues to grow, BI managers have no choice but to source solutions that can deliver the wow factor.
A great-looking front page with “designer quality” KPIs is a winning element when it comes to getting the buy-in from new customers,” says Senad Music.
And the ability to deliver quality, on time and at a competitive price is what made Vizlib Vodafone’s partner of choice.
“We were able to get some great capabilities without having to specify every detailed requirement, while, at the same time, most of our detailed needs were incorporated into the final product,” remembered Senad Music.
“Tables have never been a strong feature in Qlik. But our senior finance community, including some key decision-makers, are very keen on perfectly formatted tables, so Vizlib Pivot table was crucial.”
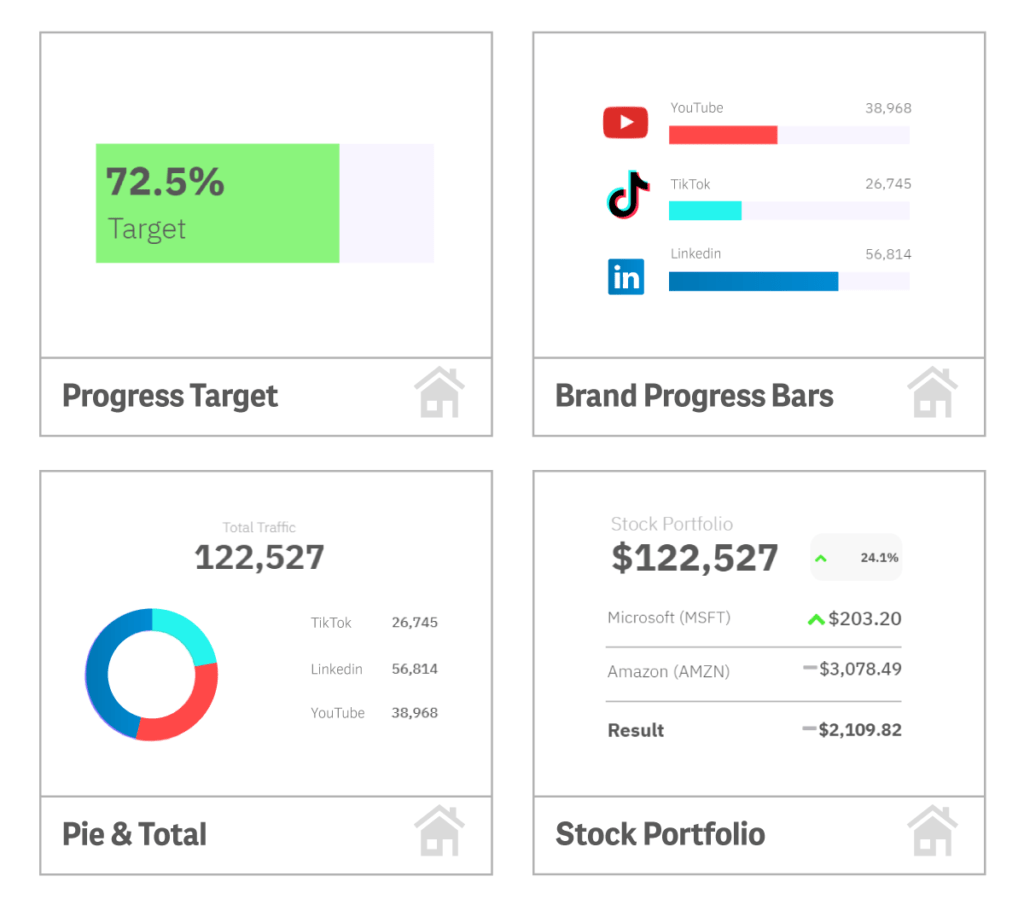
Vizlib KPI Designer
Vizlib Pivot Table
A great-looking front page with “designer quality” KPIs is a winning element when it comes to getting the buy-in from new customers.