Ways to build effective KPIs for your Qlik Sense dashboard

Running a successful organisation means always keeping your eye on the ball! Managers need to continually track how a business is performing and whether it’s making headway towards achieving its goals.
One way to check on the progress of the overall business and departments at a glance is through Key Performance Indicators, KPIs. A KPI is a measurable business metric that establishes if a company is achieving its main objectives. They’re an essential tool for visualising the performance of strategic business goals.
High-level KPIs, measuring overall business success, could include Annual Recurring Revenue (ARR) or Annual Growth. These KPIs enable managers and executives to gain insight at a glance into high-level business operations.
But KPIs don’t only benefit organisations on a high level. They also drive improvements on a departmental level. These KPIs are referred to as low-level KPIs and help to improve the workflows in sales, marketing or finance, for instance. Low-level KPIs could include metrics such as Gross Profit Margin, Cost per Lead, Net Promoter Score or Average Resolution Time.
Tip: to create KPIs that drive successful change, ensure they follow the SMART principle – Specific, Measurable, Attainable, Relevant and Time-bound.
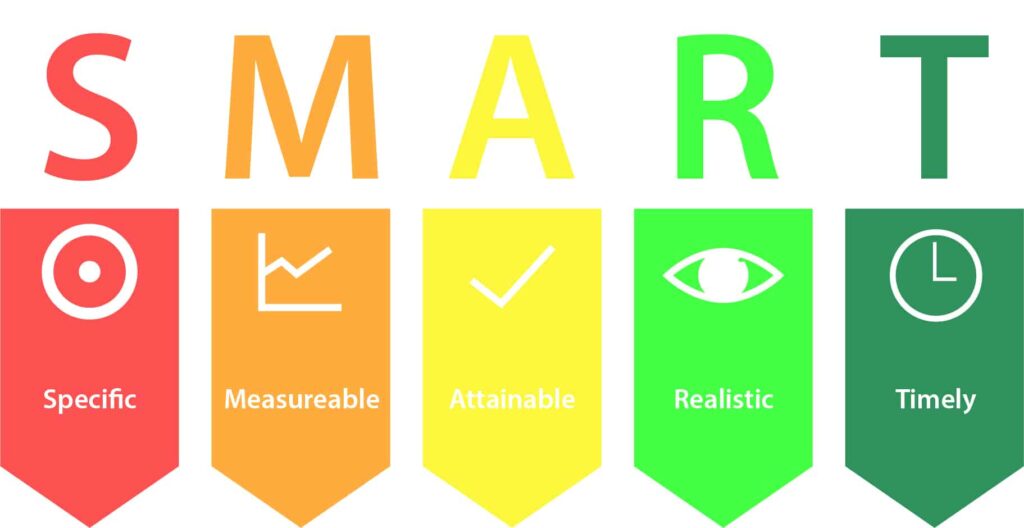
Image credit: smartcaresoftware.com
Here are a few best practices for creating winning KPIs:
- Base your KPIs on your main business drivers: what are the key things your business is trying to achieve? Once you’ve answered this question, you can then link these answers to your key business processes.
- Ensure they’re department-oriented: it’s not a one-size-fits-all model. Remember, each department has their own way of doing things.
- Break it down further to a role-based level: to ensure the best chance of success, try to break down large departmental goals into what happens at a role-level.
- Don’t drown the team in KPIs: there is such a thing as too much data. Make sure you only track metrics that will drive positive change and aren’t tracking things just for the sake of tracking them.
KPI Objects in Qlik Sense
To get the most benefit from your KPIs, you should be able to monitor and update them easily. This is possible by adding KPI Objects in your Qlik Sense dashboard.
BI teams may also want the freedom to create, style and display these KPIs in a way that communicates more effectively to their audience. Let’s explore how Vizlib KPI Designer, included in Vizlib Library, can help your business create effective KPI Objects that hook your audience.
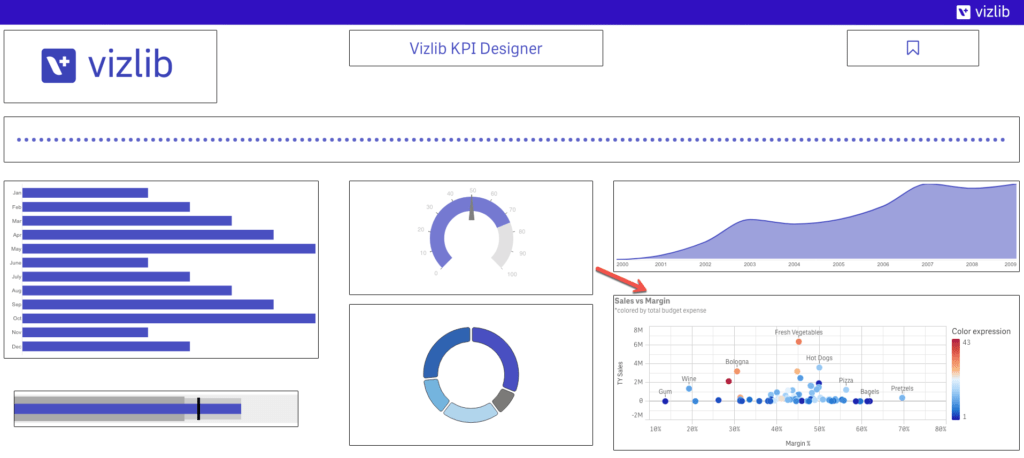
Vizlib KPI Designer: revving up your Sense dashboard
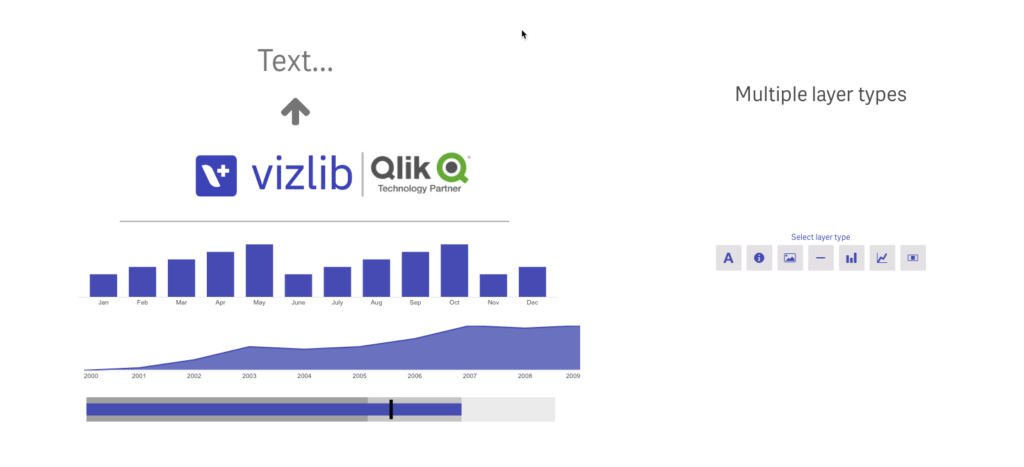
Vizlib KPI Designer enables you to create highly customized KPI Objects in Qlik Sense and monitor key metrics at a glance. You can combine elements such as charts, icons, metrics and images as different layers to create a KPI Object that supports strategic insight.
This revolutionary layering concept gives you the freedom to design your ideal KPI Objects with the precision of designer tools. And Vizlib KPI Designer includes a choice of 11 layers:
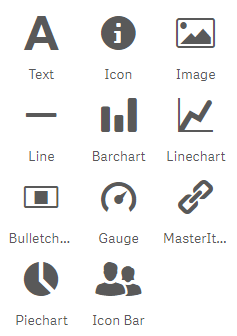
Let’s look at how these layers can add value to your BI.
1. Text layer
A key layer to add in any KPI Object. Use the Text layer to add headings or descriptions that supply more context. In healthcare, for instance, you could show the average waiting time with a Text layer.
2. Icon layer
Add icons to your dashboard rather than complicated metrics. They’re easier to digest at a glance and communicate your message more effectively. Plus they add more design style to hook your audience.
![]()
3. Image layer
Include images to add more visual context and drive home the message behind your data quicker. Or add your company branding for a professional look. Perfect for sharing BI with potential customers or partners.
4. Line layer
Make your KPIs more digestible with a Line layer. Include a Line layer to divide up your KPI Object and make the components easier to understand and consume. This layer could be helpful for the ops team when showing numerous process measurements on one dashboard.
5. Barchart layer
Add your own customized Bar Chart to show metrics more clearly and steer your audience to the right conclusions. This layer could assist manufacturers to visualize and analyze productivity levels in a quick review.
6. Linechart layer
Add more compelling content to your dashboard with a Linechart layer, for instance, in sales to visualise the total volume of sales over a specified period.
7. Bulletchart layer
Drive home a clear visual message by including a Bulletchart layer in your KPI Object. A Bulletchart layer is a powerful visual add-on to any KPI as it captures targets vs. current performance at a glance. A marketing team could use this layer to reflect how successful a new campaign was.
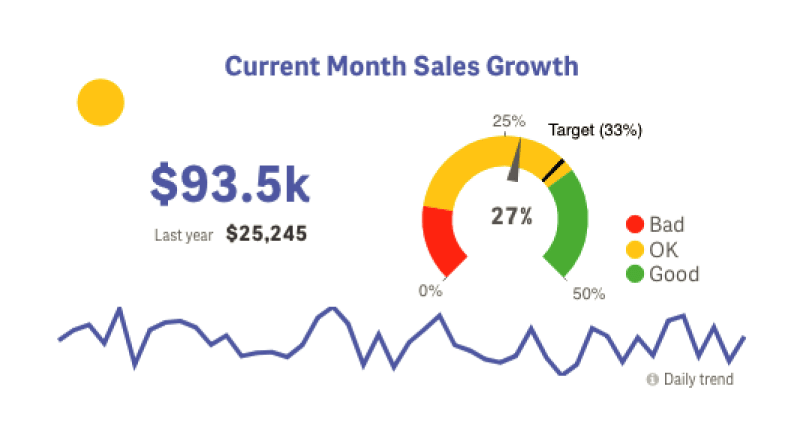
8. Gauge layer
Easily spot if metrics are ‘moving the needle’ with a Gauge layer. The Gauge layer is extremely useful for tracking the progress of a single measure, such as revenue targets vs. actual revenue. Now you can easily visualise performance against targets and see what’s “moving the needle”! This layer can help to provide executives with high-level insights at a glance.
9. MasterItem layer
Uncover business insights with a MasterItem layer. The MasterItem layer enables you to add complete visualisations as a KPI Object layer to get the full picture of the stories your data reveals.
10. Piechart layer
It’s a great idea to add a Pie Chart when you want to compare data best shown visually. If you have categorical data in particular, then include a pie chart on your KPI dashboard, as each slice can represent a different category. Customer Services could show the breakdown of the responses from a customer survey to easily spot the most common selection.
11. Icon Bar layer
Create infographic style KPIs with the Icon Bar layer. Since a visual message sinks in quicker, supplement your metrics with icon bars to easily show whether something is performing well. This layer can make your dashboard more visually appealing to catch your audience’s attention and communicate a compelling visual story, much like an infographic. The Icon Bar layer suits apps that depict COVID-19-related data in a meaningful, visual way.
![]()
![]()
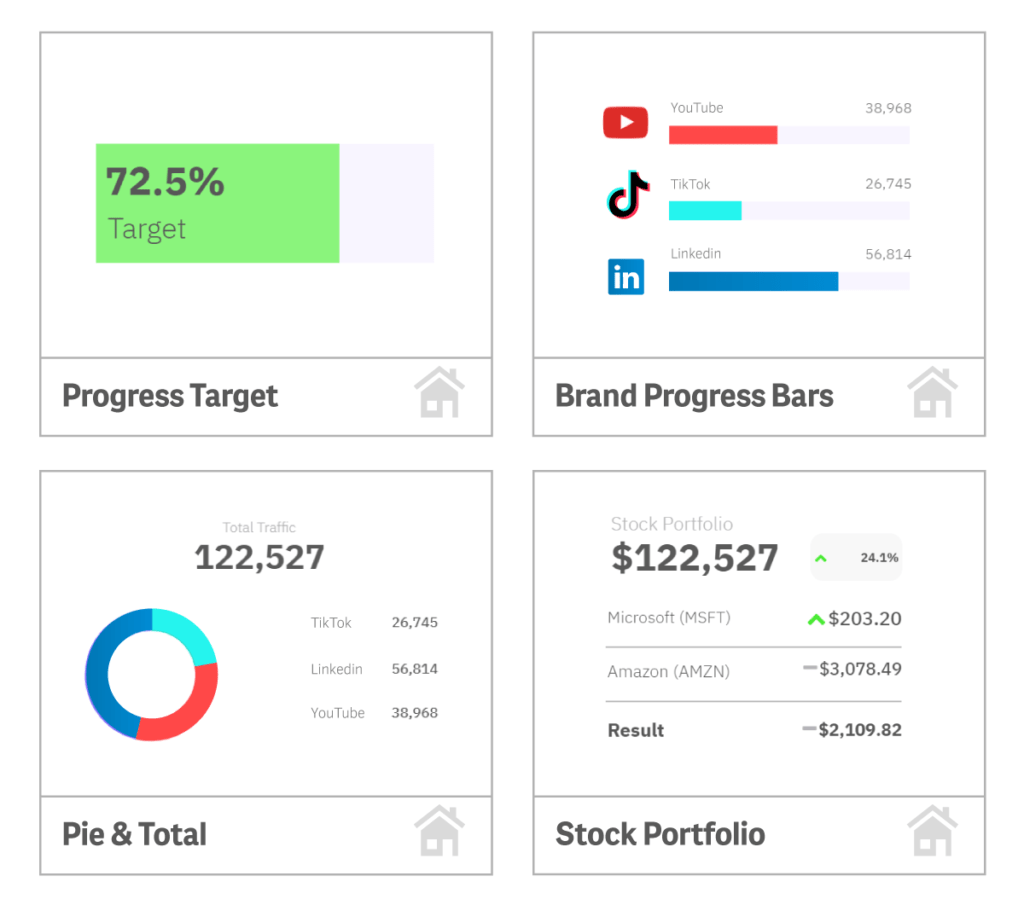
By adding layers to your KPI Object you can ensure your dashboard is effective at communicating the right message at a glance.
If you want to speed up your KPI development time and create eye-catching, standardized KPIs, take a look our KPI Designer Guide or try Vizlib Templates for KPI Designer:
Kickstart your KPI development with Vizlib’s catchy templates that will hook your audience!
Help keep your high-level and drilled-down KPIs on track with solutions such as Vizlib KPI Designer, because the power is in the visuals!