Why it’s time to retire QlikView and shift to Qlik Sense
Yes, it’s time for change! Technology and software are evolving at hyper-speed to keep up with user demand. And let’s face it, users can be pretty demanding! To keep pace with how users work with data, and prevent the business from falling behind the competition, your BI solutions must be fit for purpose.
What’s the big difference: QlikView vs Qlik Sense
Well, QlikView was the star that kicked off the data revolution. And that was no small feat. QlikView helped developers take the giant leap from stack technology to a solution that enabled them to create interactive dashboards.
Built primarily for developers, this iteration best suits users who are highly skilled. And these technically-oriented genii then create hassle-free guided analytics experiences for all other users. (Especially the kind that want to see a pretty chart and not fuss with all that modelling and analysis stuff.)
But now it’s been more than 20 years since QlikView shook up the analytics scene. We’re overdue for a change, right?
Qlik Sense is the next generation platform created by Qlik. It is easy to use and designed with the user in mind. In this case, the user includes the full spectrum, from those with high-level skills through to the everyday business user. Qlik Sense enables a modern approach to BI – making data more accessible throughout organisations and boosting data literacy.
It is still used for guided analytics as it gently steers the user through the data to the right insights. But under the hood, the smooth user journey is enabled by more than skilled devs (intricately weaving the data and dashboard components together). The extra magic in Qlik Sense lies in its embedded and augmented analytics capabilities that do a lot of the heavy lifting.
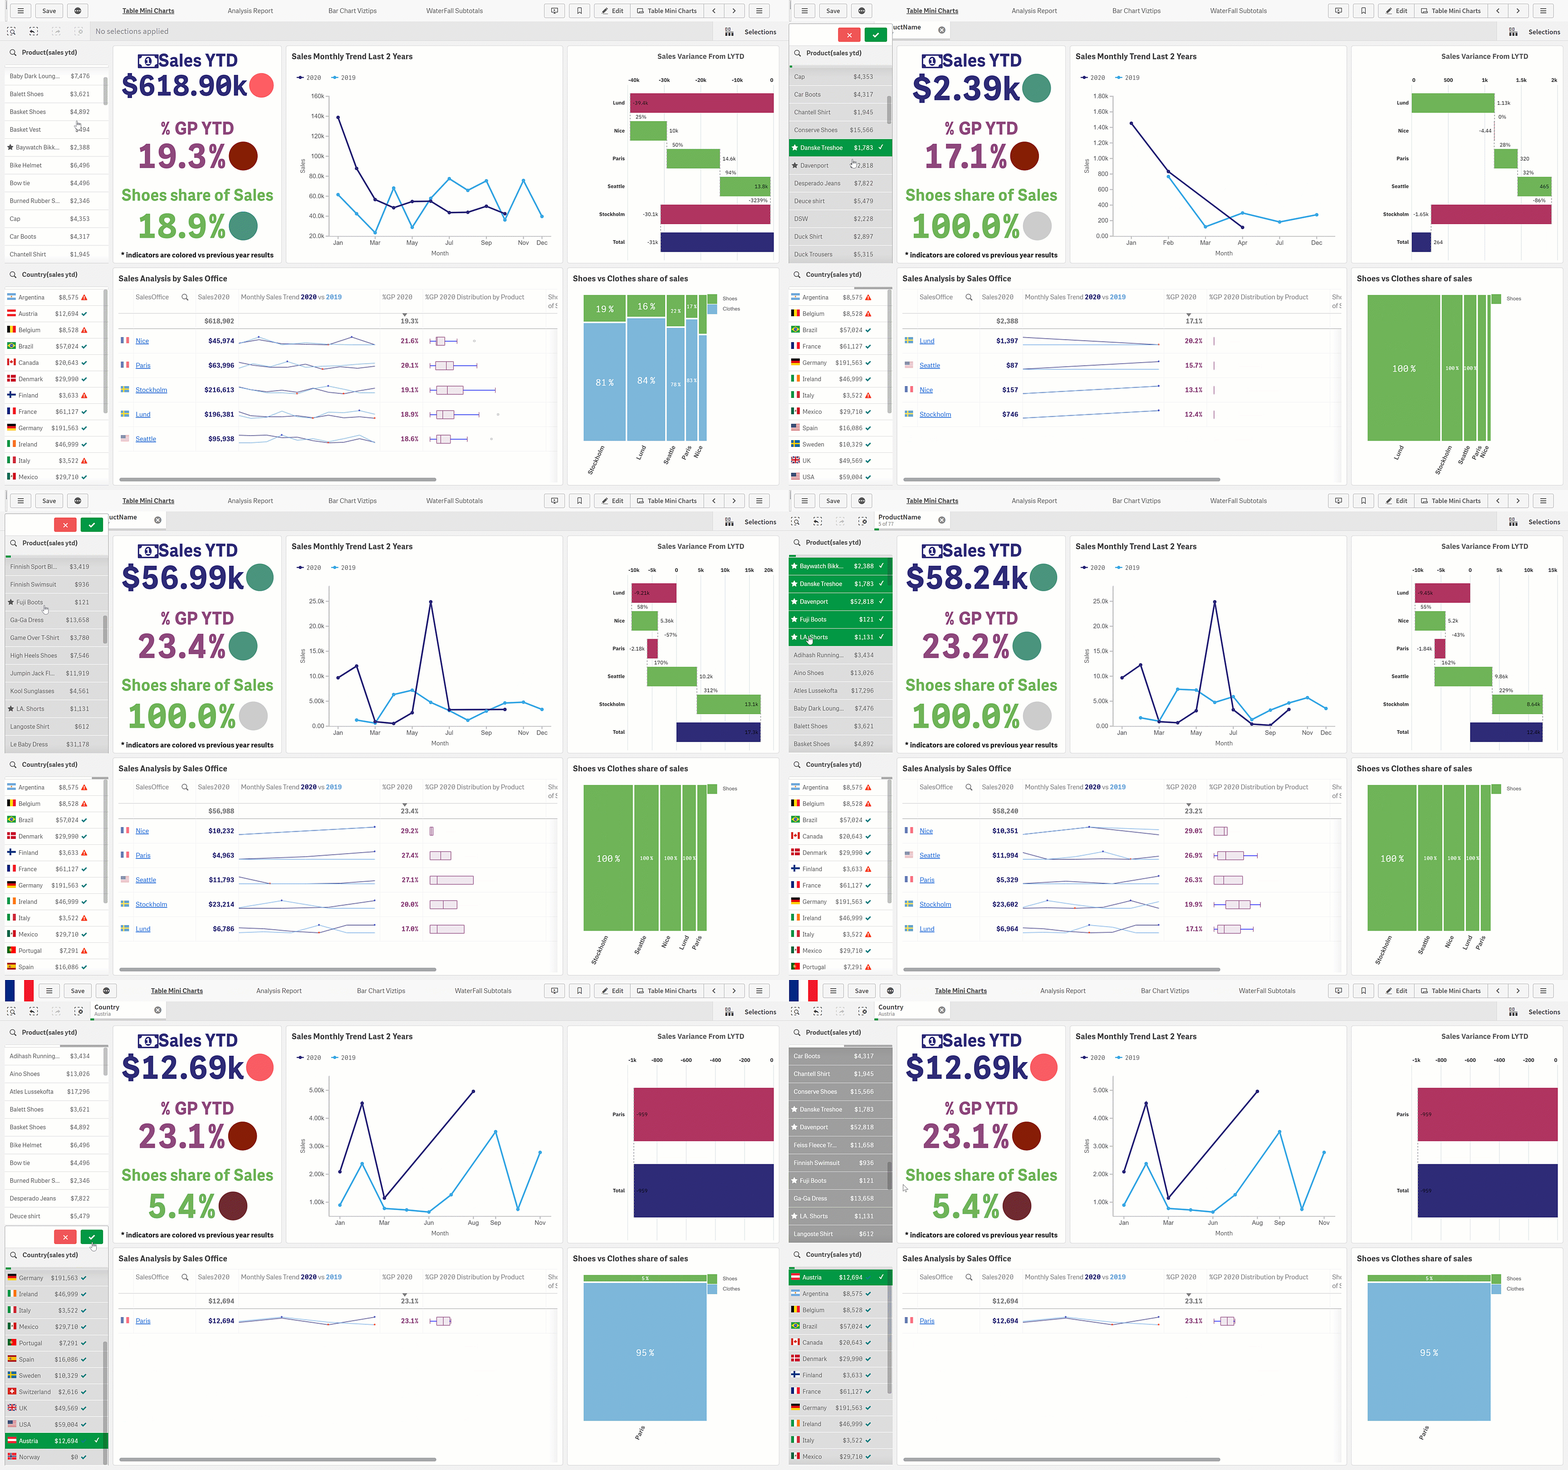
Filtering data with Vizlib Library for Qlik Sense – helping all users explore their data easily
And underpinning those key capabilities, we have the all-powerful Qlik Associative Engine, common to QlikView and Qlik Sense. Though both iterations share this fundamental, Sense is the one moving data discovery into the new era. With its responsive design, users can work with data anytime and on any device.
At this point in the analytics revolution, users should be able to ask and answer their own business questions without relying on the data science or IT team. Qlik Sense supports this drive for more self-service analytics – advancing proactive rather than reactive BI and better decision making.
More reasons to shift to Sense
Users gain more confidence in exploring data when the dashboard looks like something they use every day, such as a web browser.
Qlik Sense has a simple user interface with a familiar-looking style and layout of its menus, buttons and other components. The added UI design in Qlik Sense makes it a better choice for users who want to create and publish their own apps.
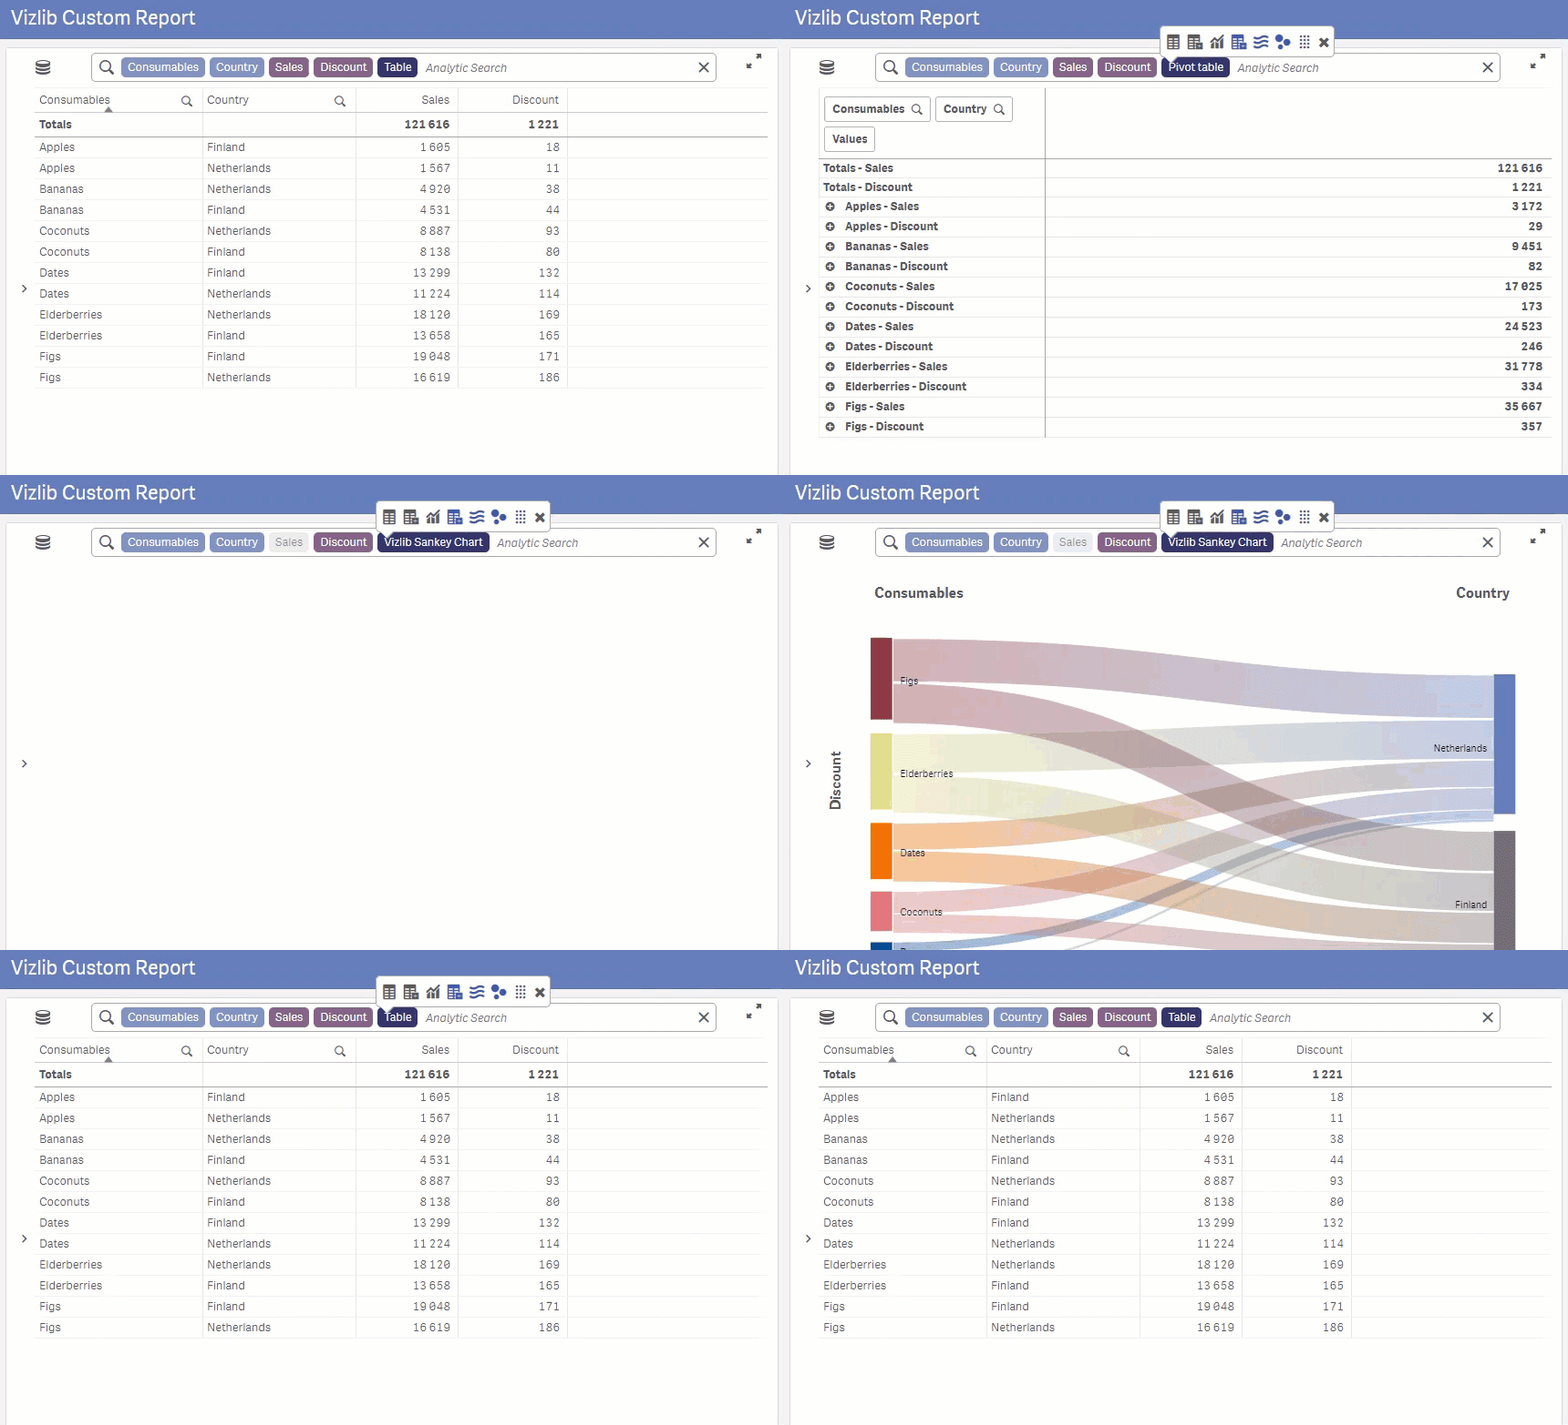
Users can query their dataset by speaking or typing, much like a web search, with Vizlib’s Analytic Search capability
This end-user focus can pay off big time for businesses. Analytics solutions that keep the end-user in mind—the way they work with data, often spark more innovation. Leading organisations, such as Novartis, champion this concept. They use Qlik Sense plus Vizlib’s highly customisable solutions to support a smooth user journey, and boost user adoption.
Why change to Qlik Sense now
Basically, Qlik Sense has the whole analytics journey covered! Especially when you combine Sense with advanced capabilities, such as Vizlib Line Chart’s Scenario Analysis and Linear Regression Modelling.
Sense benefits data users of all skill levels. For the more seasoned analyst, Qlik Sense can save you time! You don’t have to create components from scratch when you use Master Items – dimensions and measures that you create, save and reuse in your next visualisation. Take a look at how to create Vizlib Templates if you’re interested in speeding up the dev process and maintaining a consistent style and design.
And remember, change is inevitable. So if your organisation is ready to embrace the 3rd wave of BI, it’s high time to retire QlikView.
💫 If you still crave the customisability of QlikView, try Vizlib’s value-added products for Qlik Sense and power up your dashboards for all users!

